This Report Provides In-Depth Analysis of the Synthetic Fuels Market Report Prepared by P&S Intelligence, Segmented by Type (Extra-Heavy Oils, Gas-to-Liquid Fuels, Biomass-to-Liquid Fuels, Fuel-from-Waste, Fuel-from-Atmospheric Carbon, Shale Oil, Oil Sands, Coal-to-Liquid Fuels), Raw Material (Coal, Natural Gas, Non-Food Crop Sources, Food Crop Sources), Application (Gasoline, Diesel), End User (Transportation, Industrial, Chemicals), and Geographical Outlook for the Period of 2021 to 2032
Explore the market potential with our data-driven report
Synthetic Fuels Market Overview
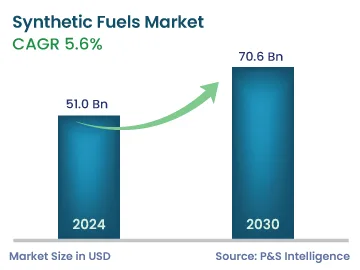
The synthetic fuels market size was USD 53.3 billion for 2025, and it will grow by 5.7% during 2026–2032, to reach USD 78.9 billion by 2032.
The rising demand for synthetic fuels is driven by their potential to reduce lifecycle greenhouse gas emissions compared with conventional fossil fuels, particularly when produced using low-carbon or renewable energy sources. This is becoming increasingly relevant as governments and industries accelerate decarbonization across hard-to-abate sectors, including aviation, marine shipping, and heavy-duty road transport. In addition, the compatibility of certain certified synthetic fuels with existing engines and fuel infrastructure can reduce the need for extensive infrastructure modifications, supporting their adoption as lower-emission alternatives to conventional fuels.
Demand is further increasing as governments translate climate commitments into production incentives, blending requirements, and other policy measures supporting sustainable fuels. According to the International Energy Agency, cumulative investment in sustainable liquid and gaseous fuels between 2024 and 2035 could reach USD 1.5 trillion, while deployment is on a path to nearly double from 2024 levels by 2030. In the United States, the U.S. Department of Energy's Section 45V clean hydrogen production tax credit supports qualifying clean hydrogen production, which can improve the economics of hydrogen-based synthetic fuel pathways such as power-to-liquid and Fischer-Tropsch routes.
Key Market Insights
The gas-to-liquid fuels category holds the largest market share, of 25%, in 2025, supported by mature Fischer-Tropsch technology, established commercial-scale experience, and abundant natural gas feedstock.
The fuel-from-atmospheric carbon category will have the highest CAGR, of approximately 6.2%, supported by increasing investment in direct air capture, expanding carbon-removal markets, and growing demand for lower-carbon drop-in fuels in aviation and shipping.
The diesel category holds the larger market share, of 75%, in 2025, driven by its extensive use in trucking, rail, marine transport, and agriculture.
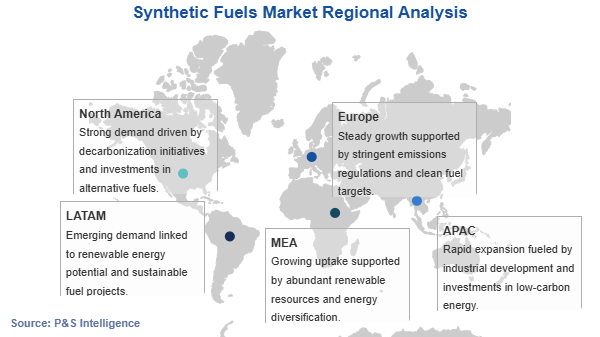
Asia-Pacific holds the largest market share, of 40%, in 2025, driven by China's coal-to-chemicals capacity, India's green hydrogen ambitions, and Japan's alternative-fuel blending targets.
North America will have the highest CAGR, of approximately 6.6%, sustained by a stacked federal incentive framework, including the Section 45V clean hydrogen production credit and the Section 45Z clean fuel production credit.
Synthetic Fuels Market Trends & Drivers
Electrolyzer Cost Reduction and Modular Production Are The Key Trends
Falling green hydrogen production costs are reshaping the economics of synthetic fuel pathways, shifting industry attention toward scalable and increasingly cost-competitive production models. Combining innovation in electrolyzer design, improved efficiency, reduced reliance on scarce materials, and economies of scale could substantially lower electrolyzer investment costs over the long term, improving the cost competitiveness of power-to-liquid and other hydrogen-based synthetic fuel pathways.
Producers are increasingly considering the integration of synthetic fuel facilities with low-cost renewable electricity sources to reduce electricity and hydrogen input costs. These developments are particularly relevant to power-to-liquid and other renewable hydrogen-based synthetic fuel routes, although conventional gas-to-liquid and coal-to-liquid pathways can retain cost advantages in certain applications. According to the International Renewable Energy Agency, electrolyzer investment costs could be reduced by up to 80% in the long term through a combination of innovation, improved electrolyzer design, economies of scale, larger system sizes, mass manufacturing, and optimization of materials and supply chains.
Energy Security Imperatives and Decarbonization Commitments Are Biggest Drivers
Energy security concerns following recent supply disruptions are prompting countries to diversify energy supplies and reduce dependence on imported crude and refined fuels, while decarbonization commitments are increasing demand for lower-emission fuels in hard-to-abate sectors such as aviation, marine shipping, and heavy industry. According to the International Energy Agency, renewable fuel demand across industry, buildings, and transport stood at 22 exajoules (EJ) in 2023, equivalent to approximately 5% of energy demand in these sectors, and renewable fuel deployment is expected to expand by a further 4 EJ by 2030.
Growth is concentrated in Brazil, China, Europe, India, and the United States, which together account for around two-thirds of renewable fuel growth through 2030. Although bioenergy accounts for most of this expansion, renewable hydrogen and e-fuels are also expected to increase from very low levels, particularly in aviation and maritime applications, supporting investment in power-to-liquid and other synthetic fuel pathways.
High Green Hydrogen Production Costs Are a Key Restraint
The elevated cost of green hydrogen remains a key restraint on the market because hydrogen is a major feedstock for power-to-liquid and other renewable-hydrogen-based synthetic fuel pathways. High renewable electricity costs, electrolyzer capital expenditure, and electricity consumption during hydrogen production increase the overall cost of synthetic fuels, making them less competitive with conventional fossil-based fuels. Many synthetic fuel projects require policy incentives, subsidies, or long-term offtake agreements to achieve commercial viability.
The challenge is particularly significant for power-to-liquid pathways that combine green hydrogen with captured carbon dioxide, as carbon capture or direct air capture adds further capital and operating costs. These high input costs can delay final investment decisions, limit the development of large-scale commercial facilities, and concentrate new projects in regions with abundant low-cost renewable energy. Therefore, continued reductions in renewable electricity and electrolyzer costs are important for improving the competitiveness and accelerating the adoption of synthetic fuels.
Expanding National Hydrogen Strategies Is Biggest Opportunity
The proliferation of national hydrogen strategies is opening new geographic production opportunities for synthetic fuels, particularly in resource-rich economies seeking to diversify their energy systems and develop new export industries. This expansion creates opportunities for regions such as the Middle East, North Africa, and parts of Latin America to position themselves as suppliers of green hydrogen and hydrogen-derived fuels to import-dependent markets in Europe and Northeast Asia.
Infrastructure development and certification frameworks are also progressing to support cross-border trade and verification of the emissions intensity of hydrogen and its derivatives. As these supply corridors mature, producers can gain access to international markets beyond domestic demand, supporting the development of export-oriented synthetic fuel capacity. According to the International Renewable Energy Agency, as of May 2024, more than 50 countries had published national hydrogen strategies, collectively targeting 113.5 gigawatts (GW) of electrolyzer capacity by 2030.
Synthetic Fuels Market Segmentation Analysis
Type Analysis
The gas-to-liquid fuels category holds the largest market share, of 25%, in 2025, supported by mature Fischer-Tropsch technology, established commercial-scale operating experience, and the availability of natural gas feedstock across major producing economies. The United States recorded a record average of 118.5 billion cubic feet per day of marketed natural gas production in 2025, providing a substantial domestic feedstock base for gas-based fuel production. Established Fischer-Tropsch infrastructure and integrated energy operations further support the competitiveness of gas-to-liquid pathways, although their economics remain sensitive to natural gas prices and carbon-related costs.
The fuel-from-atmospheric carbon category will have the highest CAGR, of approximately 6.2%, supported by increasing investment in direct air capture, expanding carbon-removal markets, and growing demand for lower-carbon drop-in fuels in aviation and shipping. According to the International Energy Agency, advanced offtake agreements for carbon dioxide removal reached close to 6 million tonnes in 2024, involving developers of direct air capture and bioenergy-with-carbon-capture projects. The expansion of carbon-removal infrastructure and associated offtake commitments could support the future availability of captured CO₂ feedstock for atmospheric-carbon-based synthetic fuel pathways.
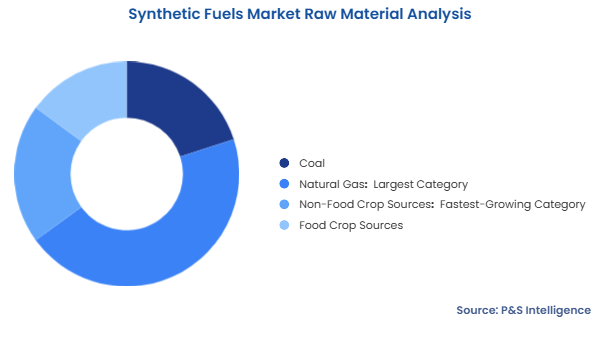
The natural gas category holds the largest market share, of 45%, in 2025, supported by the United States' position as the world's largest natural gas producer since 2011 and record domestic dry natural gas output. This sustained supply abundance keeps gas-based feedstock costs competitive relative to coal and biomass alternatives, reinforcing natural gas's role as the preferred feedstock for large-scale Fischer-Tropsch and methanol-to-gasoline conversion facilities across North America, the Middle East, and parts of Asia.
The non-food crop sources category will have the highest CAGR, because of the rising concerns over food security. The first-generation processes used sugarcane, corn, soybean, and rapeseed to produce bio-ethanol, creating potential competition between fuel production and food/feed uses. In contrast, second-generation biofuels are made by advanced technologies that use residual or non-food parts of crops, such as stems, husk, and leaves. According to the U.S. Department of Energy, the United States could sustainably produce more than 1 billion tons of biomass per year, including resources such as energy crops, forest biomass, and macroalgae. Moreover, advanced technologies, such as thermochemical routes and gasification, are being used to process these raw materials into fuels, syngas, and other energy products.
The raw materials analyzed in this report are:
Coal
Natural Gas (Largest Category)
Non-Food Crop Sources (Fastest-Growing Category)
Food Crop Sources
Application Analysis
The diesel category holds the larger market share in 2025, supported by the extensive use of diesel fuels across medium- and heavy-duty trucking, rail, marine transportation, agriculture, and other freight-intensive applications. The established use of diesel and the compatibility of synthetic diesel with existing diesel engines and fuel infrastructure support its continued importance as a synthetic fuel application. In the United States, distillate fuels accounted for approximately 22% of total transportation-sector energy consumption in 2025, highlighting the substantial demand base for diesel fuels.
The gasoline category will have the higher CAGR, of approximately 5.8%, supported by rising renewable fuel requirements and increasing demand for lower-carbon transportation fuels. The U.S. Environmental Protection Agency established a total renewable fuel volume requirement of 25.82 billion RINs for 2026, strengthening regulatory support for renewable fuel deployment.
The applications analyzed in this report are:
Gasoline (Faster-Growing Category)
Diesel (Larger Category)
End User Analysis
The transportation category holds the largest market share, of 60%, in 2025, driven by the continued reliance on liquid fuels across road freight, aviation, marine transportation, and other energy-intensive mobility applications. The usage of electric vehicles is increasing rapidly around the world, but the transportation industry still depends heavily on fossil fuels. Additionally, internal combustion engines offer added advantages in heavy vehicles and sports cars, or even in remote areas, where the supply of electricity is inadequate. The carbon footprint of the transportation sector can be decreased if e-fuels are produced with hydrogen from an emission-free or low-carbon source and the carbon dioxide used in the production process is captured from suitable sources. Moreover, since certain certified e-fuels can be used in compatible existing engines and fuel infrastructure, there may be less need for extensive new vehicle and fuel-distribution infrastructure. This factor could continue to drive the market amidst the global shift to EVs.
The chemicals category will have the highest CAGR, driven by rising demand for low-carbon feedstocks in chemical and petrochemical production, increasing deployment of e-methanol and power-to-liquid pathways, and growing efforts by chemical manufacturers to reduce their reliance on conventional fossil-based feedstocks. The expansion of renewable hydrogen and carbon-capture infrastructure is also improving the availability of alternative feedstocks, supporting the development of synthetic fuel-based chemical production.
The end users analyzed in this report are:
Transportation (Largest Category)
Industrial
Chemicals (Fastest-Growing Category)
Drive strategic growth with comprehensive market analysis
Synthetic Fuels Market Geographical Analysis
Asia-Pacific Synthetic Fuels Market Size
Asia-Pacific holds the largest market share, of 40%, in 2025, driven by China's large-scale coal-to-chemicals conversion capacity, India's expanding green hydrogen production ambitions, and Japan's blending targets for alternative marine and aviation fuels. Rising energy security concerns across the region are pushing governments to reduce import dependence on crude oil through domestic coal, biomass, and renewable-hydrogen-based fuel pathways. Regional demand is further reinforced by shipping-sector methanol adoption, with fuel suppliers in China, Japan, and South Korea scaling production to serve new methanol-powered vessel orders.
According to the International Energy Agency, global sustainable aviation fuel consumption is expected to increase from 1 billion litres in 2024 to 9 billion litres by 2030, supported by policy measures including SAF mandates and targets in major aviation markets.
North America Synthetic Fuels Market Size
North America will have the highest CAGR, of approximately 6.6%, sustained by a stacked federal incentive framework, including the Section 45V clean hydrogen production credit and the Section 45Z clean fuel production credit. Section 45V supports qualifying clean hydrogen production, while Section 45Z provides incentives for qualifying clean transportation fuel production, improving the economics of eligible low-carbon fuel pathways. The region's mature refining and pipeline network allows synthetic diesel and gasoline to enter distribution with minimal retrofit capital, while established gas processing infrastructure supports natural-gas-fed gas-to-liquid capacity.
Continued policy certainty through 2029 is expected to sustain North America's leadership as new commercial-scale facilities reach final investment decision. According to the Congressional Research Service, taxpayers meeting prevailing wage and apprenticeship requirements were eligible for a maximum clean hydrogen production credit of USD 3.185 per kilogram in 2025, with amounts adjusted annually for inflation.
U.S. Synthetic Fuels Market Size
The U.S. represents the largest and fastest-growing country market within North America, driven by strong federal incentives for low-carbon fuels, increasing investment in clean hydrogen and synthetic fuel production, established refining and pipeline infrastructure, and rising demand for lower-emission fuels across aviation, transportation, and other hard-to-abate sectors. The Section 45Z clean fuel production credit applies to qualifying fuel produced after December 31, 2024, and was extended through December 31, 2029. The credit provides an emissions-based incentive for qualifying transportation fuels, supporting lower-emission production pathways. Existing refining and energy infrastructure can also facilitate the integration of synthetic fuel production, potentially reducing infrastructure requirements for new projects.
According to the Internal Revenue Service, qualifying transportation fuel must be produced in the United States at a qualified facility and have a lifecycle greenhouse gas emissions rate of not more than 50 kilograms of CO₂-equivalent per mmBTU. The IRS includes gasification and Fischer-Tropsch among certain eligible fuel pathways within the Section 45Z emissions-rate framework, subject to applicable feedstock, emissions, production, and certification requirements.
Europe Synthetic Fuels Market Size
Europe held significant share of the synthetic fuels market, supported by stringent decarbonization policies, expanding renewable energy capacity, and growing investment in renewable hydrogen and power-to-liquid technologies. Germany held the largest country market within the European market, underpinned by industrial policy alignment, established energy and automotive infrastructure, and increasing investment in synthetic fuel production.
The European Commission's ReFuelEU Aviation regulation establishes harmonized and binding sustainable aviation fuel requirements across EU member states, providing greater market certainty for fuel suppliers, airports, and airlines. The regulation also establishes dedicated minimum shares for synthetic aviation fuels, increasing from 1.2% in 2030 to 35% in 2050, supporting the development of power-to-liquid e-kerosene projects across Europe. According to the European Commission, ReFuelEU Aviation is expected to deliver a reduction in aviation CO₂ emissions of more than 60% by 2050 compared with 1990 levels. The regulation is also designed to stimulate investment in sustainable aviation fuel production through a predictable, harmonized regulatory framework.
The regions and countries analyzed in this report are:
North America (Fastest-Growing Regional Market)
U.S. (Larger and Faster-Growing Country)
Canada
Europe
Germany (Largest Country)
U.K.
France
Italy
Spain (Fastest-Growing Country)
Rest of Europe
Asia-Pacific (Largest Regional Market)
China (Largest Country)
India (Fastest-Growing Country)
Japan
South Korea
Australia
Rest of APAC
Latin America
Brazil (Largest and Fastest-Growing Country)
Mexico
Rest of LATAM
Middle East and Africa
Saudi Arabia (Largest Country)
South Africa
U.A.E. (Fastest-Growing Country)
Rest of MEA
Synthetic Fuels Market Competitive Landscape
The market has a fragmented competitive structure due to the coexistence of multiple technologically distinct production pathways, including Fischer-Tropsch, power-to-liquid, gas-to-liquid, coal-to-liquid, and biomass-to-liquid. No single participant dominates the overall market, as companies often specialize in specific technologies, feedstocks, or production stages. Established energy majors compete alongside state-linked producers, technology licensors, equipment suppliers, and emerging e-fuel developers, creating a diverse competitive landscape. The market is further fragmented by differences in feedstock availability, production technologies, engineering requirements, and regional energy policies. High capital requirements and technical complexity limit the ability of smaller companies to compete in large-scale production, while the early commercial stage of several synthetic fuel technologies continues to attract specialized technology providers and project developers.
Leading Companies in the Synthetic Fuels Market:
Sasol Limited
Shell Plc
Exxon Mobil Corporation
Chevron Corporation
PetroChina Company Limited
Reliance Industries Ltd.
Indian Oil Corporation Ltd.
Phillips 66 Company
Robert Bosch GmbH
TotalEnergies SE
Neste Oyj
Synhelion SA
LanzaTech Global, Inc.
Johnson Matthey plc
Topsoe A/S
Synthetic Fuels Market Developments
In July 2026, Topsoe A/S and Sasol Limited signed a licensing and engineering agreement with Allied Biofuels to supply gas-to-liquid synfuels technology for a USD 6.1 billion green hydrogen-based e-fuels project in Uzbekistan, targeting more than 400,000 tonnes of aviation fuel annually, including approximately 300,000 tonnes of eSAF and SAF.
In November 2025, LanzaTech Global, Inc.'s affiliate LanzaJet, Inc. began full operation and commercial-scale fuel production at its Freedom Pines Fuels facility in Soperton, Georgia, becoming the world's first commercial-scale plant to convert ethanol into sustainable aviation fuel and renewable diesel. The facility is designed to produce approximately 9 million gallons of SAF and 1 million gallons of renewable diesel annually.
In October 2025, Neste Corporation started up the world's largest multi-megawatt high-temperature electrolyzer in an industrial environment at its Rotterdam renewable products refinery, producing more than 60 kilograms of renewable hydrogen per hour. The project, developed under the MultiPLHY consortium, demonstrates a pathway to replace fossil-based hydrogen in refinery operations with renewable alternatives.
In June 2025, TotalEnergies SE announced a EUR 500 million investment to transform its Grandpuits refinery in France into a zero-crude platform, targeting 230,000 tonnes of sustainable aviation fuel (SAF) production annually from 2026 and more than 500,000 tonnes per year across its European refining network by 2028. The investment supports TotalEnergies' expansion of SAF production capacity as the European Union strengthens its SAF blending requirements.
Frequently Asked Questions About This Report
What are the major drivers of the synthetic fuels market?+
The major drivers include growing demand for low-carbon fuels, decarbonization targets, government support for sustainable aviation fuels and e-fuels, and increasing investment in renewable hydrogen and carbon capture technologies.
What are the key trends in the synthetic fuels market?+
Key trends include increasing investment in power-to-liquid (PtL) technologies, development of sustainable aviation fuel (SAF), integration of renewable hydrogen with captured carbon, and expansion of commercial-scale synthetic fuel projects.
Which region is expected to grow fastest in the synthetic fuels market?+
North America is expected to be the fastest-growing region, supported by federal incentives for clean hydrogen and fuels.
What are the major challenges facing the synthetic fuels market?+
Major challenges include high production costs, substantial capital requirements, limited availability of low-cost renewable electricity and green hydrogen, technological complexity, and the need for supporting infrastructure.
What opportunities exist in the synthetic fuels market?+
Major opportunities include the expansion of e-fuels for aviation and shipping, increasing demand for sustainable aviation fuel, technological improvements that reduce production costs, and government incentives supporting low-carbon fuel projects.
Want a report tailored exactly to your business need?
Leading companies across industries trust us to deliver data-driven insights and innovative solutions for their most critical decisions. From data-driven strategies to actionable insights, we empower the decision-makers who shape industries and define the future. From Fortune 500 companies to innovative startups, we are proud to partner with organisations that drive progress in their industries.
Client Testimonials
Working with P&S Intelligence and their team was an absolute pleasure – their awareness of timelines and commitment to value greatly contributed to our project's success. Eagerly anticipating future collaborations.
McKinsey & Company
India
Unmatched Standards
Our insights into the minutest levels of the markets, including the latest trends and competitive landscape, give you all the answers you need to take your business to new heights
Complete Data Security
We take a cautious approach to protecting your personal and confidential information. Trust is the strongest bond that connects us and our clients, and trust we build by complying with all international and domestic data protection and privacy laws