U.S. Natural Gas Market Size & Share Analysis - Key Trends, Future Opportunities, Growth Strategies, and Forecasts (2025 - 2032)
This Report Provides In-Depth Analysis of the U.S. Natural Gas Market Report Prepared by P&S Intelligence, Segmented by Type (Wet Natural Gas, Dry Natural Gas), End Use (Power Generation, Automotive, Residential, Industries), Source (Coal, Nuclear Energy, Hydro Electric, Renewables), and Geographical Outlook for the Period of 2019 to 2032
Explore the market potential with our data-driven report
U.S. Natural Gas Market Analysis
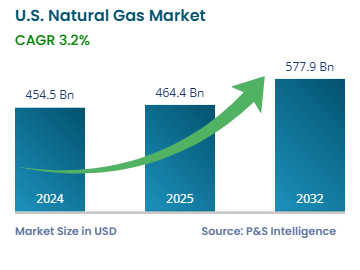
The U.S. natural gas market was valued at USD 454.5 Billion in 2024, and this number is expected to increase to USD 577.9 Billion by 2032, advancing at a CAGR of 3.2% during 2025–2032.
The key drivers for the market are the rising domestic electricity generation, LNG exports, rising demand in industries and for residential and commercial heating, expanding storage capacity and pipeline infrastructure, government regulations and environmental policies, growing shale gas output, increasing global energy prices, and technological advancements for higher extraction and refining efficiency.
The rising market need for natural gas combines with global industrial export possibilities despite increasing international consumption levels. The U.S. Energy Information Administration (EIA) predicts natural gas demand will rise to 3.2 billion cubic feet per day (Bcf/d) by 2025 because of liquefied natural gas (LNG) exports becoming essential demand sources. New LNG export facilities such as Plaquemines LNG and Corpus Christi LNG Stage 3 have started operations, which strengthened the country's export capabilities.
Natural gas production is projected to increase on the supply side but at a rate slower than forecasted demand growth. For 2025, the EIA foretells that natural gas supply will rise by 1.4 Bcf/d. Numerous market influences including weather conditions economic growth rates and natural gas storage activity will affect prices. The Natural Gas Supply Association (NGSA) believes winter weather extents and peak consumption patterns create pricing volatility during winter months due to heat requirements.
Natural gas serves as a key solution to push the sector toward pollution-free energy sources because it generates less carbon than oil and coal. Total growth in the U.S. natural gas market becomes possible due to rising demands and expanding export opportunities. Environmental elements, together with price fluctuations, will remain significant factors that require observation in upcoming years.
U.S. Natural Gas Market Emerging Trends & Growth Drivers
Technological Innovations in Extraction and Refining Are Key Trends
Horizontal drilling and fracturing have unlocked vast shale gas reserves, accounting for over 75% of U.S. dry natural gas production.
The U.S. emerged as a leader in gas production because new drilling technologies discovered massive underground wells.
Enhanced seismic imaging, real-time data analytics, and automated drilling systems have reduced costs and improved precision.
In refining, improvements in cryogenic processing, carbon capture, and methane leak detection have increased yield and reduced emissions.
These technologies have helped the U.S. become the world’s top natural gas producer, supporting both domestic energy needs and a growing LNG export market.
The application of carbon capture and storage (CCS) technology coupled with smart methane detection instruments enhances natural gas operations by achieving higher efficiency together with environmental sustainability.
The CCS technology combination captures carbon dioxide emissions at their source before atmospheric release while utilizing underground drilling methods alongside sophisticated leak detection systems to ensure prompt leak identification.
Rising Demand for Renewable Energy Is Key Driver
The biggest driver for the market is the growing demand for cleaner energy sources.
The EIA says that natural gas occupied a 36% share in the country’s energy mix in 2023.
Electric infrastructure reliability improves through this trend which also decreases carbon footprints.
Natural gas operators are employing it in combination with wind and solar projects to ensure dependable power generation throughout intermittent renewable periods.
Natural gas integration with the power grid guarantees consistent energy delivery to support the growing renewable energy infrastructure in developing a cleaner energy future.
Public liquified natural gas (LNG) export facilities in the U.S. are responsible for the remarkable growth seen in nationwide natural gas exports.
As per the IEA, the country already has over 3 million miles of pipelines to distribute this commodity.
According to 2023 statistics, the U.S. achieved its highest natural gas export volumes while LNG exports surpassed half of American natural gas shipments.
The new Plaquemines LNG, together with Corpus Christi LNG Stage 3 facilities, grew U.S. export capabilities to supply rising global customers with environmentally friendly fuel.
U.S. Natural Gas Market Segmentation Analysis
Type Insights
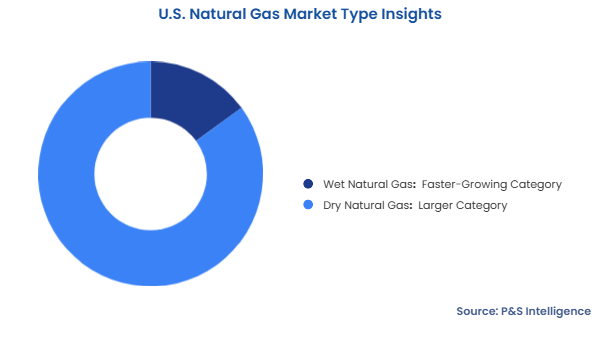
The dry bifurcation dominates the market with 85% value share. The processed methane product exists primarily as natural gas, which undergoes purification steps to eliminate water vapor and additional hydrocarbons. Dry natural gas provides efficient power generation, industrial heating solutions, and residential heat service because it burns cleanly while containing high levels of energy value. Dry natural gas controls the market because of its massive processing infrastructure and vital role in producing electricity.
The wet bifurcation will have the higher CAGR, of approx. 3.5%, over the forecast period. The demand for wet natural gas in the U.S. remains strong due to its valuable natural gas liquids (NGLs) content, including ethane, propane, and butane. These NGLs are critical feedstocks for the petrochemical industry, especially in plastics and fuel production, supporting industrial growth and export market expansion.
The types studied in this report:
Wet Natural Gas (Faster-Growing Category)
Dry Natural Gas (Larger Category)
End Use Insights
Power generation dominates the market with 45% value share. The largest division for natural gas usage in the U.S. exists within power generation. Natural gas stands out as a key electricity generation resource thanks to its efficient operation, cost-efficient production, and reduced polluting properties over coal. Natural gas-based power plants have become the essential support system of America's electrical network because of increased coal plant retirements alongside national emission reduction strategies. Competitive prices and abundant domestic natural gas reserves have maintained natural gas's position as a leading power generation-sector foundation. As per the EIA, 39.25 quadrillion Btu of energy were produced in the U.S. from natural gas in 2023.
Automotive is the fastest-growing category, with a CAGR, due to the growing government efforts for reducing emissions from the transportation sector. According to the Environmental Protection Agency (EPA), the transportation sector held the largest share in the GHG emissions in the U.S. in 2022, of 28%. There are roughly 114,000–135,000 CNG vehicles, about 270,000 propane (LPG) vehicles, and a smaller fleet of LNG trucks. Supporting infrastructure includes around 700–900 public CNG stations and about 50–70 LNG stations, mainly for long-haul trucks.
End use covered in this report:
Power Generation (Largest Category)
Automotive (Fastest-Growing Category)
Residential
Industries
Source Insights
The renewable energy sector is the largest and fastest-growing category with 40% share in 2024 and 3.8% CAGR over the forecast period, respectively. Renewable energy covers different resource types, including wind power alongside solar generation, hydroelectric generation, and bioenergy sources. Experts forecast major renewable energy market expansion until 2030, when the predicted capacity will reach 790.19 Gigawatts from its initial 2025 value of 480.08 Gigawatts. The transition towards renewable energy occurs because of government support combined with lower renewable technology expenses and expanding investments by the public and private sectors.
Major source area covered in this report:
Coal
Nuclear Energy
Hydro Electric
Renewables (Largest and Fastest-Growing Category)
Others
Drive strategic growth with comprehensive market analysis
U.S. Natural Gas Market Regional Market Performance
The South is the prime revenue contributor, with 55% share, as well as the fastest-growing region, with a CAGR over the forecast period. Natural gas-producing giants Texas and Louisiana anchor this region because the states contain large gas reserves along with extensive facilities for extraction and distribution. The Gulf of Mexico proximity enables large-scale LNG export operations across the south, thus strengthening its financial value contribution. The region maintains its status as a major revenue contributor because the many petrochemical plants and industrial facilities continually generate substantial needs for natural gas. As a result of its abundant production and strategic geographic position alongside its forceful industrial requirements, the South generates the most revenue in the U.S. natural gas market.
These regions are covered:
West
Northeast
Midwest
South (Largest and Fastest-Growing Region)
U.S. Natural Gas Market Share Analysis
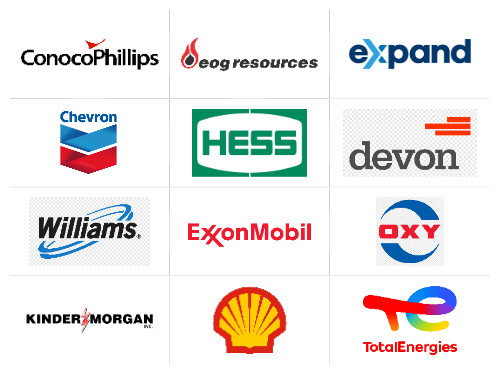
The market is fragmented due to multiple participants extending through the value chain, which begins with production and continues through distribution until exports. Natural gas production occurs across multiple U.S. basins in which large multinational companies such as ExxonMobil and Chevron share operations with smaller independent producing entities. This geographic dispersion of industry operations maintains market power distribution, which enhances competition between key players.
The market expands due to regulatory control administered through federal, state, and local government authorities, allowing smaller businesses to develop positions in specialized market segments. Alongside the existing independent operators in midstream and downstream sectors that include pipelines, LNG export facilities, and utility companies, the market remains subdivided. The U.S. natural gas market demonstrates decentralized organization through its regional business operations and regulatory fragmentation and extensive range of natural gas segment activities within the energy sector.
Key U.S. Natural Gas Companies:
Exxon Mobil Corporation
Chevron Corporation
ConocoPhillips Company
EOG Resources, Inc.
Shell plc
Occidental Petroleum Corporation
Devon Energy Corporation
Expand Energy Corporation
TotalEnergies SE
Hess Corporation
Williams Companies, Inc.
Kinder Morgan, Inc.
U.S. Natural Gas Market Developments
In May 2025, Kimmeridge Texas Gas LLC, Commonwealth LNG (a subsidiary of Kimmeridge Energy Management Company LLC), and Glencore LTD. formed a strategic natural gas and LNG partnership for Glencore to purchase 2 million tonnes per annum of LNG for 20 years from Commonwealth and KTG each at international prices.
In February 2025, Entergy Corporation announced an agreement with Kinder Morgan Inc., in partnership with Golden Pass LNG. A component of Kinder Morgan's USD 1.7-billion Trident Intrastate Pipeline initiative, the 216-mile pipeline will convey natural gas from the Permian Basin and other sources at the Katy hub to the LNG and industrial corridor close to Port Arthur, Texas.
In October 2024, Kinder Morgan Inc. announced plans to expand Gulf Coast Express (GCX) pipeline capacity to 570 million cubic fee0t per day. The expansion project targets Mexico-bound natural gas exports, as well as Gulf Coast LNG needs and is scheduled for completion by 2027.
In December 2024, The Williams Companies Inc. executed the Southside Reliability Enhancement project to increase the Transco pipeline's delivery capacity in North Carolina and Virginia to 423,400 dekatherms per day (Dth/d). The project addresses region-wide demand for dependable sustainable energy as it powers power installations serving more than 2 million households.
Want a report tailored exactly to your business need?
Leading companies across industries trust us to deliver data-driven insights and innovative solutions for their most critical decisions. From data-driven strategies to actionable insights, we empower the decision-makers who shape industries and define the future. From Fortune 500 companies to innovative startups, we are proud to partner with organisations that drive progress in their industries.
Client Testimonials
Working with P&S Intelligence and their team was an absolute pleasure – their awareness of timelines and commitment to value greatly contributed to our project's success. Eagerly anticipating future collaborations.
McKinsey & Company
India
Unmatched Standards
Our insights into the minutest levels of the markets, including the latest trends and competitive landscape, give you all the answers you need to take your business to new heights
Complete Data Security
We take a cautious approach to protecting your personal and confidential information. Trust is the strongest bond that connects us and our clients, and trust we build by complying with all international and domestic data protection and privacy laws