Market Statistics
| Study Period | 2019 - 2030 |
| 2024 Market Size | 46.3 Billion |
| 2030 Forecast | 66.0 Billion |
| Growth Rate(CAGR) | 6.1% |
| Largest Region | North America |
| Fastest Growing Region | Asia-Pacific |
| Nature of the Market | Fragmented |
Report Code: 12773
Get a Comprehensive Overview of the Fluid Power Equipment Market Report Prepared by P&S Intelligence, Segmented by Type (Hydraulic, Pneumatic), End User (Construction, Automotive, Oil & Gas, Chemicals, Aerospace & Defense, Metals & Mining, Food & Beverage, Medical Equipment), Component (Pumps, Motors, Valves, Cylinders, Filters, Actuators), and Geographic Regions. This Report Provides Insights From 2019 to 2030.
| Study Period | 2019 - 2030 |
| 2024 Market Size | 46.3 Billion |
| 2030 Forecast | 66.0 Billion |
| Growth Rate(CAGR) | 6.1% |
| Largest Region | North America |
| Fastest Growing Region | Asia-Pacific |
| Nature of the Market | Fragmented |

Explore the market potential with our data-driven report
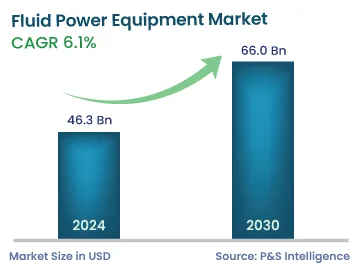
The fluid power equipment market size stood at USD 46.3 billion in 2023, and it is expected to grow at a compound annual growth rate of 6.1% during 2024–2030, to reach USD 66.0 billion by 2030.
The equipment uses fluids to transmit power from one place to another. These types of tools are primarily operated by using two processes, namely, hydraulic and pneumatic. The hydraulic method uses liquids specifically oil to transmit power and the pneumatic system uses gas generally compressed air to transmit power. These systems are essential components of machines and help in improving their efficiency. Hence, hydraulic and pneumatic components are used to reduce error and increase performance.
The power equipment produces high pressures compared to electrical propelled systems. Whereas, mechanical systems consist of complicated operations and include belts, chains, and linkages. Also, these systems need high maintenance in comparison to fluid power tools. However, fluid systems are easy to handle and have simple designs, which attract relatively more users utilizing these systems in end products.
The working fluid passing through a motor provides cooling to it and produces negligible sparks, which could be hazardous containing flammable vapors. Also, the inclination toward fluid-electrified components is rising, owing to several benefits compared to electrical and mechanical systems. Moreover, the increasing use of industrial hardware coupled with the surging use of fluid power systems helps in reducing repair costs and production time. Additionally, rapid urbanization and a rise in purchasing capacity are expected to positively impact the market growth.
Furthermore, the demand for hydraulic equipment is predicted to grow at a noticeable rate, especially in developing countries in the coming years. This can be due to the rising inclination of manufacturers to utilize these systems to perform heavy machinery jobs and the commercialization of shale gas technology. In addition, the rising utilization of smart valves to gain better control over processes and the growing automation in factories to support consistency and greater operational efficiency are positively influencing the market. Further, the development of several user-friendly products is offering expansion opportunities to end-users and investors, worldwide.
Additionally, the Food and Drug Administration (FDA) guidelines are implemented in this field for stringent hygiene and disinfection requirements. This compels producers and suppliers to meet proper machinery cleaning requirements. As pneumatic equipment is cleaner than any other equipment, it is used in a variety of applications in the food and agriculture industries.
The rapidly growing population and the increasing need for water and wastewater infrastructure worldwide lead to surging investments in water and wastewater treatment facilities. This, in turn, increases the demand for pumps, motors, valves, and other fluid power components.
Government bodies express their concerns about the changes required for eliminating pollution’s impact on the environment. The introduction of regulations regarding waste and environmental impacts is gaining traction in this field. To meet regulations, hydraulic equipment and mineral oil manufacturers conduct quality checks of their products. These quality checks ensure that all systems are in proper working condition and reduce the occurrence of spillages. Thus, these favorable regulatory standards can enhance the need for fluid power products in the coming time.
Key players operating in the market are investing heavily in R&D to diversify their product lines, which spurs their growth. Also, companies are adopting several strategic developments, such as product launches, collaborations, and investments, to expand their presence globally. Also, the companies manufacture products locally to reduce production costs and offer products at competitive and affordable prices. Further, the introduction of several user-friendly fluid products is offering considerable expansion opportunities to industry players.
The construction category contributed the largest revenue share, of 25%, to the market in 2023. This is due to the high utility of such components in a variety of applications in the construction sector, such as material handling and demolition. Also, companies operating in this sector can enhance efficiency by utilizing technology to reduce costs and improve job safety.
Whereas, the automotive industry is witnessing tremendous growth, owing to the growing consumer disposable income coupled with the rising living standards, globally. The rapid development in this industry can also be attributed to the increased production and sales of vehicles and the high requirement for different components in various applications.
Furthermore, the oil & gas category is projected to witness significant traction in several regions over the forecast period. This can be attributed to the increasing hydrocarbon production activities worldwide.
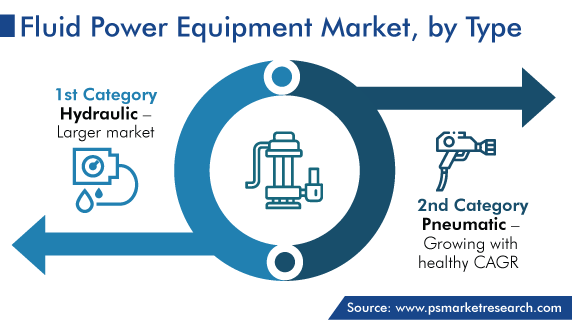
Among different types, the hydraulic category held the leading position in 2023, contributing USD 26.3 billion revenue. The prominent factors supporting the augmentation of the hydraulic category include the high efficiency and cost-effectiveness of this type of system and widely used in construction and oil & gas applications.
Whereas, the pneumatic category is expected to grow at a healthy CAGR in the forthcoming years. This can be because these systems depend on the pressure of compressed air to transmit power and are significantly used in different industrial applications. Pneumatic valves are offered in multiple designs, configurations, and sizes, and hence permit free flow in one direction and restrict flow in the reverse direction. Furthermore, companies are focusing on offering varied designs of pneumatic equipment. Also, these types of products can be customized according to applications with the necessary pressure and force.

The motors category holds the largest market share. This is because motor components offer high power and torque and are used widely in a diverse range of industries, such as automotive, agriculture, and construction. Additionally, the upgradation in motor technologies improves their efficiency and performance and hence are cost-effective solutions for companies to utilize them in various applications.
Whereas, the valves category is expected to grow at a highest CAGR during the forecast period. This can be because of the surging need for valves to monitor high pressure, which will augment the valve component demand. Also, pneumatic valves, such as mechanical valves, manual valves, vacuum-piloted valves, and air-piloted valves, are highly used in the life sciences and medical industry and other industrial applications, as these systems use the force of compressed air to transmit power. Moreover, the expansion of Industry 4.0 supported by advancements in technologies results in rapid growth in the utility of smart valves to gain control over several processes.
The increasing automation in several industries, such as packaging, construction, automotive, oil & gas, agriculture, semiconductor, and chemicals, is propelling the need for equipment. Additionally, fluid power component is lucrative, owing to the increasing popularity of electric vehicles and the rising use of robots in the automotive sector. Moreover, the growing trend of using pneumatic components for different processes coupled with the surging need for energy-efficient systems is supporting the demand for fluid power equipment.
Drive strategic growth with comprehensive market analysis
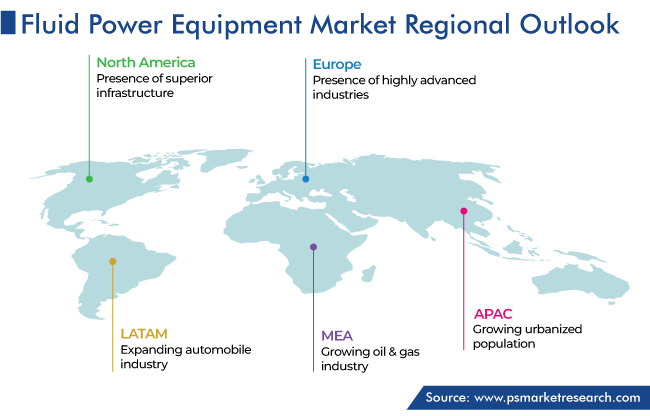
North America accounted for the largest revenue share, of 50%, in 2023. This is due to the presence of superior infrastructure, the growing development in manufacturing and R&D activities, and the rising number of initiatives taken to ensure the safety of workers in industries, such as chemicals and oil and gas.
The U.S. leads the North American market. This is because companies operating in the country are continuously introducing electric construction machines that utilize electric motors with hydraulic pumps and the presence of major industry players. Such innovations are further projected to accelerate the adoption of hydraulic equipment in the U.S.
Europe has a high potential market for fluid power equipment. This is due to the presence of highly advanced industries that utilize these components in their operations. Moreover, Germany has some of the leading manufacturers of aerospace equipment. For instance, the landing gear of aircraft utilizes hydraulic components. These systems are deployed in the aerospace industry substantially, thereby accelerating the demand for power equipment.
On the other hand, the APAC market is predicted to witness the highest CAGR, of 6.5%, during the forecast period. This can be ascribed to the growing urbanized population coupled with the rising demand for energy, and the surging expansion of the automobile and construction sectors in countries such as India, Japan, and China. Moreover, the significant expansion of infrastructure in India coupled with rapid growth in the automotive sector is boosting the demand for fluid power systems. Further, Japan has well-developed automation and technology sectors, which leads to an increase in the need for power components.

This fully customizable report gives a detailed analysis of the fluid power equipment industry, based on all the relevant segments and geographies.
Based on Type
Based on End User
Based on Component
Geographical Analysis
Key players operating in the market are investing heavily in R&D to diversify their product lines, which spurs their growth. Also, companies are adopting several strategic developments, such as product launches, collaborations, and investments, to expand their presence globally. Also, the companies manufacture products locally to reduce production costs and offer products at competitive and affordable prices. Further, the introduction of several user-friendly fluid products is offering considerable expansion opportunities to industry players.
Want a report tailored exactly to your business need?
Request CustomizationLeading companies across industries trust us to deliver data-driven insights and innovative solutions for their most critical decisions. From data-driven strategies to actionable insights, we empower the decision-makers who shape industries and define the future. From Fortune 500 companies to innovative startups, we are proud to partner with organisations that drive progress in their industries.


Working with P&S Intelligence and their team was an absolute pleasure – their awareness of timelines and commitment to value greatly contributed to our project's success. Eagerly anticipating future collaborations.
McKinsey & Company
IndiaOur insights into the minutest levels of the markets, including the latest trends and competitive landscape, give you all the answers you need to take your business to new heights
We take a cautious approach to protecting your personal and confidential information. Trust is the strongest bond that connects us and our clients, and trust we build by complying with all international and domestic data protection and privacy laws
Customize the Report to Align with Your Business Objectives
Request the Free Sample Pages