Market Statistics
| Study Period | 2019 - 2032 |
| 2024 Market Size | USD 1.8 Billion |
| 2025 Market Size | USD 1.9 Billion |
| 2032 Forecast | USD 2.7 Billion |
| Growth Rate(CAGR) | 5.5% |
| Largest Region | Northeast |
| Fastest Growing Region | West |
| Nature of the Market | Fragmented |

| Study Period | 2019 - 2032 |
| 2024 Market Size | USD 1.8 Billion |
| 2025 Market Size | USD 1.9 Billion |
| 2032 Forecast | USD 2.7 Billion |
| Growth Rate(CAGR) | 5.5% |
| Largest Region | Northeast |
| Fastest Growing Region | West |
| Nature of the Market | Fragmented |
|
Explore the market potential with our data-driven report
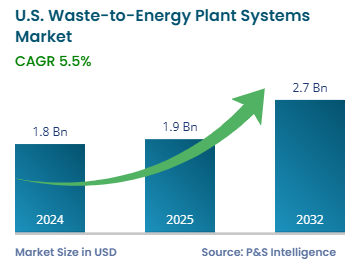
The U.S. waste-to-energy plant market size was USD 1.8 billion in 2024, and it will grow by 5.5% during 2025–2032, reaching USD 2.7 billion by 2032.
The market is driven by waste generation increase, environmental preservation needs, and renewable energy acceptance. More than 60 WTE facilities in the U.S. processed waste to produce electricity in 2022. The main technological approaches for waste-to-energy operation are incineration, gasification, pyrolysis, and anaerobic digestion. WTE technology holds status as a renewable power generation method that helps fulfill national clean energy objectives and reduce fossil fuel usage. The U.S. produces over 290 million tons of MSW each year, which creates escalating difficulties in management. Public agencies now work with private companies to create new infrastructure.
The thermal category held the largest market share, of 65%, in 2024 due to its well-established infrastructure, high energy efficiency, and ability to process large volumes of waste. Over 80% of WTE plants in the country use thermal technologies.
The biological category will grow at the highest CAGR, during the forecast period.
This is because public institutions are implementing organic waste recycling and methane capture initiatives to meet the targets of carbon reduction. The California SB 1383 law forces cities to redirect their organic waste away from landfills, thus driving the need for biological WTE facilities. Enhanced efficiency in biofuel refining and better biogas production make biological WTE more popular.
The technologies analyzed here are:
The municipal solid waste category held the largest market share, of 55%, in 2024 because of its high-volume production. WTE plants in the country have produced approximately 14,000 GWh of power from MSW every year since the previous decade, indicating its crucial role in energy generation.
The agricultural waste category will grow at the highest CAGR, during the forecast period. This is because of the sustainable energy initiatives requiring bioenergy production from agricultural waste materials and new strategies. Moreover, the utilization of agricultural biomass for energy has received backing through federal and state investments in this sector.
The waste types analyzed here are:
The electricity generation category held the largest market share, of 70%, in 2024 because more than 90% of these facilities generate power. The power grid receives electricity from WTE facilities, which offer an environmentally friendly substitute to fossil fuels. WTE facilities in the country produced 14 billion kilowatt-hours of electricity in 2022, enough to power 1 million homes throughout the year.
The combined heat and power category will grow at the highest CAGR, during the forecast period because WTE-based combined heat and power systems continue to gain adoption in industries, universities, and hospitals. This is because they lead to sustainability and cost reduction by producing more from a given amount of feedstock.
The applications analyzed here are:
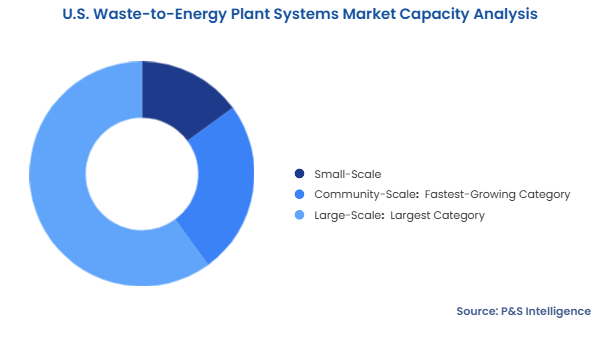
The large-scale category held the largest market share, of 60%, in 2024. This is because large facilities reduce costs through advanced technologies, such as mass-burn incineration and gasification, and achieve maximum energy recovery and minimized emissions. Major firms operating large-scale facilities include Covanta, Wheelabrator Technologies, and Veolia. The electrical output from large WTE facilities surpasses 50 MW, which makes them appropriate for both grid connection and base-load energy production.
The community-scale category will grow at the highest CAGR, during the forecast period. Community-scale facilities meet environmental regulations better because they create fewer emissions. Many private companies have joined forces with city administrations to establish waste-to-energy facilities that operate from community systems, to power electricity grids and heating networks.
The capacities analyzed here are:
The combustion system category held the largest market share, of 40%, in 2024. Mass-burn incineration is used in almost 80% of the WTE plants in the U.S. The system produces heat at temperatures above 850 degrees Celsius, and this generated heat creates steam for power generation.
The flue gas treatment system category will grow at the highest CAGR, during the forecast period. This is because the EPA’s Clean Air Act and state policies have lowered emission limits, requiring plants to upgrade flue gas cleaning systems. Concerns about toxic emissions, including dioxins, SOâ‚‚ and NOâ‚“, motivate facilities to adopt advanced filtration systems due to environmental regulations.
The systems analyzed here are:
Drive strategic growth with comprehensive market analysis
The Northeast region of the U.S. held the largest market share, of 45%, in 2024 because urban areas along the East Coast generate substantial municipal solid waste, necessitating efficient waste management solutions. The Northeast has a long history of adopting WTE technologies, leading to a well-developed infrastructure. Over 60% of the U.S. WTE plants are located in the Northeast.
The Western region will grow at the highest CAGR, during the forecast period because California has aggressive zero-waste and clean energy goals, encouraging WTE adoption. With a focus on reducing fossil fuel dependence, Western states are turning to WTE for alternative energy production. California is investing in WTE plants as part of its goal to cut landfill waste by 75% by 2030.
The regions analyzed in this report are:
The market is considered fragmented because it includes a mix of large, established companies and smaller, regional players. The market features multiple operators of WTE facilities with major differences in their sizes and processing technologies. While a few large utilities are located, numerous community-scale plants operate in the country. The companies that provide systems for these plants are, similarly, diverse. While the major companies offer high-capacity systems, the smaller companies offer lower-capacity technologies for local and community needs.
Want a report tailored exactly to your business need?
Request CustomizationLeading companies across industries trust us to deliver data-driven insights and innovative solutions for their most critical decisions. From data-driven strategies to actionable insights, we empower the decision-makers who shape industries and define the future. From Fortune 500 companies to innovative startups, we are proud to partner with organisations that drive progress in their industries.

Working with P&S Intelligence and their team was an absolute pleasure – their awareness of timelines and commitment to value greatly contributed to our project's success. Eagerly anticipating future collaborations.
McKinsey & Company
India
Our insights into the minutest levels of the markets, including the latest trends and competitive landscape, give you all the answers you need to take your business to new heights

We take a cautious approach to protecting your personal and confidential information. Trust is the strongest bond that connects us and our clients, and trust we build by complying with all international and domestic data protection and privacy laws


Customize the Report to Align with Your Business Objectives

Request the Free Sample Pages