Logo - P&S Intelligence
  • Home
  • Report Store
    • Report Store
      • Consumer Products
      • Life Sciences
      • ICT and Media
      • Semiconductor and Electronics
      • Chemicals and Materials
      • Automotive and Transportation
      • Power and Energy
      • Heating & Cooling
      • Aerospace & Defense
      • Construction & Heavy Machinery
    • Back
  • Services
  • Knowledge Center
    • Knowledge Center
      • Press Journals
      • Blogs
      • Case Studies
    • Back
  • About Us
  • Contact Us
U.S. Valves Market
  • Buy Report
  • Home
  • Construction & Heavy Machinery
  • Equipment Machine and Tooling
  • U.S. Valves Market

U.S. Valves Market Size & Share Analysis - Trends, Drivers, Competitive Landscape, and Forecasts (2024 - 2030)

Get a Comprehensive Overview of the U.S. Valves Market Report Prepared by P&S Intelligence, Segmented by Type (Ball, Butterfly, Gate, Globe, Check, Plug), Material (Steel, Iron, Alloy), Application (Oil & Gas, Power Generation, Chemical, Water & Wastewater, Mining), and Geographic Regions. This Report Provides Insights from 2019 to 2030.

  • Published: June 2024
  • Pages: 180
  • Report Code: 13111
Share:
  • Order this report
  • Inquire Before Ordering
Build Data-Driven Growth Strategies

This report contains the pivotal information you need to refine and strengthen your business strategy.

Need Assistance?
  • +91 93541 34657
  • [email protected]
  • Report Summary
  • Table of Contents
  • Sample Pages

U.S. Valves Market Size

Market Statistics

Study Period 2019 - 2030
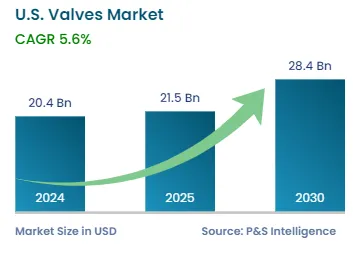
2024 Market SizeUSD 20.4 Billion
2025 Market SizeUSD 21.5 Billion
2030 ForecastUSD 28.4 Billion
Growth Rate(CAGR) 5.6%
Largest RegionSouth
Fastest-Growing RegionSouth
Nature of the Market Fragmented
Largest Application Category Oil & Gas

Growth Forecast

U.S. Valves Market Size

Key Players

U.S. Valves Market Players

Key Report Highlights

  • Value Chain Analysis
  • Regulatory Landscape
  • Pricing Analysis
  • Companies’ Recent Strategic Developments
  • Key Stakeholders
  • Voice of Industry Experts/KOLs
  • Future Opportunities

Explore the market potential with our data-driven report

U.S. Valves Market Future Prospects

The U.S. valves market will generate an estimated revenue of USD 20.4 billion in 2024 and witness a CAGR of 5.6% during 2024–2030, reaching USD 28.4 billion by 2030. This growth is due to the rising demand for valves in various applications, such as oil and gas and food and beverage processing, in the U.S. The oil and gas sector, in particular, is a major use of valves for their upstream and downstream operations.

The installation of valves in manufacturing and process plants is becoming mandatory due to the rise of U.S. government regulations on emissions, effluent control, and workplace safety. Moreover, the growing demand for energy due to the rising population leads to the growth in the energy sector. Due to this, power plants are experiencing a rise in the demand for valves.

Additionally, R&D in this market helps expand the application areas in various industries, including energy, power, and chemicals.

U.S. Valves Market Trends & Growth Drivers

Emission Reduction and Energy Efficiency Are Key Trends in Market

  • Valves play an important role in controlling fluid flow in various industrial processes.
  • Manufacturers have started developing energy-efficient valve designs that will help minimize the pressure drop and reduce the energy requirement for maintaining the fluid flow.
  • Gas valve leakage can contribute to the release of harmful substances, such as methane, volatile organic compounds (VOCs), and other pollutants.
  • To deal with this, the players are focusing on developing low-emission valve technologies that will help minimize leakage.

Growing Chemical and Petrochemical Industries Are Key Driver for Market

  • The chemical and petrochemical sectors, in particular, are the main users in the valve market.
  • This is due to the crucial role these parts play in regulating the flow of fluid and gases in various operations.
  • The demand for valves in the U.S. is driven by the development of new facilities as well as the expansion and modernization of existing chemical and petrochemical plants.
  • Additionally, various factors drive this market, such as the increasing production capacity and renovation of current facilities to increase efficiency and adhere to the changing safety and environmental standards.

Lack of Material Availability and Supply Is Major Challenge for Market

  • The valve manufacturing process is significantly dependent on a complicated supply chain, which includes a variety of parts, raw materials, and specialized equipment, which are supplied from multiple sources.
  • Various factors can affect the availability of materials and cause difficulties in the supply chain, including natural disasters, geopolitical tensions, and trade disputes.
  • This can lead to shortages or delays in the import of valve components and materials from numerous regions and countries.

U.S. Valves Market Analysis

Type Insights

  • The ball category will dominate the market by contributing 35% revenue in 2024.
  • This variant is popular due to its adaptability, ease of operation, and reliable sealing properties. They are easily available in different materials, sizes, and configurations to meet diverse industry requirements.
  • The globe category is expected to witness significant CAGR in 2024−2030, due to the increasing need for accurate flow control and process automation.
  • Globe valves are primarily used for controlling and regulating flow in applications, particularly those that require precise control, such as in power plants and chemical processing facilities.

The types covered in the report include:

  • Ball (Largest Category)
  • Butterfly (Fastest-Growing Category)
  • Gate
  • Globe
  • Check
  • Plug
  • Others

Material Insights

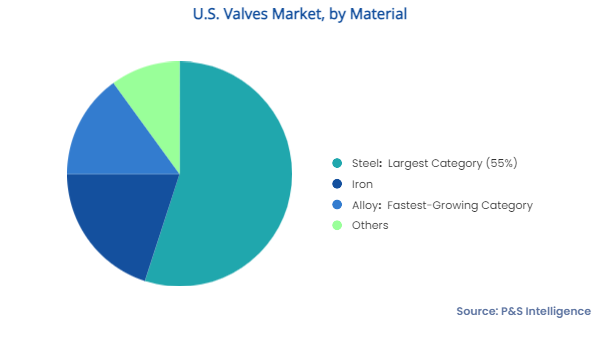
  • The steel category dominates the market by contributing 55% revenue in 2024. Valves made of steel offer strength, durability, and the capability to deal with high temperatures and pressure conditions.
  • In the steel category, carbon steel and stainless-steel variants are the most common as they can serve a wide range of applications across various industries.
  • The alloy category is expected to witness a highest CAGR in 2024−2030.
  • Nickel- and titanium alloys remain popular in the oil and gas, chemical processing, and power generation industries.

U.S. Valves Market Segments

The materials covered in the report are:

  • Steel (Largest Category)
  • Iron
  • Alloy (Fastest-Growing Category)
  • Other

Applications Insights

  • The oil & gas category will dominate the market in 2024.
  • The oil and gas sector, which includes upstream, midstream, and downstream operations, is one of the main users of valves in the U.S. They are used during the exploration, production, transportation, refining, and distribution of oil and gas.
  • In 2023, the U.S. produced approximately 12.9 million barrels of crude oil per day.
  • The power generation category is expected to witness a CAGR of 6.0% in 2024−2030.
  • The demand for valves is rising significantly in both traditional and renewable energy power plants.
  • Power plants need the efficient transfer of a range of fluids and gases from one system to another, which makes valves imperative here.

The following applications are included in the report:

  • Oil & Gas (Largest Category)
  • Power Generation (Fastest-Growing Category)
  • Chemicals
  • Water & Wastewater
  • Mining
  • Others

Drive strategic growth with comprehensive market analysis

Regional Analysis

South Is Largest Region

  • The southern region will acquire the largest market share, of around 50%, in 2024, and it will become the fastest-growing market, with a CAGR of 5.9%, in 2024−2030.
  • This is because this region, especially Texas, Louisiana, and Oklahoma, is the hub of the oil and gas industry, as well as petrochemical and chemical processing facilities.
  • In 2023, 1.92 billion barrels of oil and gas were produced in Texas.
  • The Midwest also holds a significant share owing to its productive manufacturing industries, such as automotive, machinery, and industrial equipment.
  • These industries have a high demand for valves for various applications, which makes this region a major market for valves.

The regions analyzed for this report include:

  • Northeast
  • Midwest
  • West
  • South (Largest and Fastest-Growing Region)

U.S. Valves Market Share

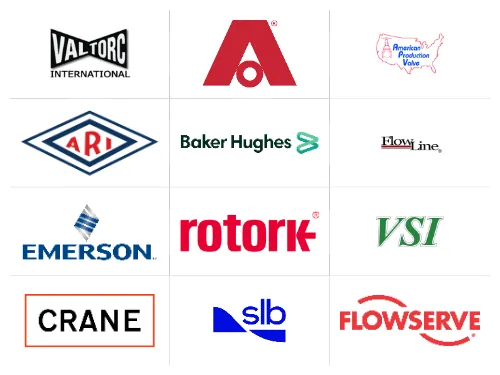
This market is fragmented in nature because of the presence of various key players, including Ari Valve Corporation, Schlumberger NV, Baker Hughes Company, Flowserve Corporation, and Emerson Electric Co. Valve demand is rising with the growth of the U.S. processing industry. Thus, companies are continuously innovating products and expanding their national presence via mergers and acquisitions and capacity expansion, which is increasing the competition.

Top Valve Companies in the U.S.:

  • Ari Valve Corporation
  • Emerson Electric Co.
  • Schlumberger N.V.
  • Baker Hughes Company
  • Flowserve Corporation
  • Crane Holdings Co.
  • Rotork Plc
  • Valtorc International
  • Valve Solutions Inc.
  • Flow Line Valve and Controls L.L.C.
  • American Production Valve
  • American Cast Iron Pipe Company

U.S. Valves Market News

  • In December 2023, Trive Capital announced the formation of a new industrial distribution company, Venturi Supply.
  • In December 2022, Emerson Electric Co. launched the Crosby J-Series pressure relief valve product line to increase efficiency and reduce emissions.
  • In April 2022, Emerson Electric Co. introduced a new three-way Series 090 valve configuration for its ASCO Series 090 line of miniature solenoid valves, which enables lighter, more space-efficient solutions, especially for gas control during oxygen therapy, compression therapy, and gas analysis devices.

Want a report tailored exactly to your business need?

Request Customization

Empowering Leaders Across the Globe

Leading companies across industries trust us to deliver data-driven insights and innovative solutions for their most critical decisions. From data-driven strategies to actionable insights, we empower the decision-makers who shape industries and define the future. From Fortune 500 companies to innovative startups, we are proud to partner with organisations that drive progress in their industries.

Client Partners
Client Partners (mobile view)
Testimonials
Client Testimonials

Working with P&S Intelligence and their team was an absolute pleasure – their awareness of timelines and commitment to value greatly contributed to our project's success. Eagerly anticipating future collaborations.

McKinsey & Company

India
Unmatched Standards
Unmatched Standards

Our insights into the minutest levels of the markets, including the latest trends and competitive landscape, give you all the answers you need to take your business to new heights

Data Security
Complete Data Security

We take a cautious approach to protecting your personal and confidential information. Trust is the strongest bond that connects us and our clients, and trust we build by complying with all international and domestic data protection and privacy laws

  • Request Customization
  • Request Free Sample
close

Customize the Report to Align with Your Business Objectives

*
*
*
close

Request the Free Sample Pages

*
*
*
Connect with us
Quick Links
  • Research Methodology
  • Career
  • Media Citations
  • FAQs
  • Events and Conferences
Find Help
  • How to Order
  • Privacy Policy
  • Terms & Conditions
  • Sitemap
24/7 Customer Support
  • India: +91 93541 34657
  • For business enquiries - [email protected]
  • For career enquiries - [email protected]
  • Dun-Verified
  • Paypal-Secure

©2026 P&S Intelligence. All Rights Reserved.

We use cookies to enhance your experience. By continuing to use this site you consent to our use of cookies. Privacy Policy