Explore the market potential with our data-driven report
Knowledge Graph Market Future Outlook
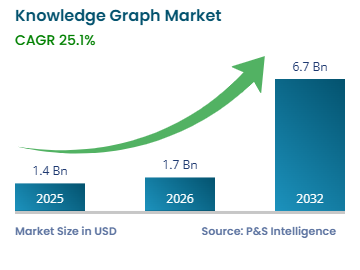
The knowledge graphs market size was USD 1.4 billion for 2025, and it will grow by 25.1% during 2026–2032, to reach USD 6.7 billion by 2032.
This growth is supported by the accelerating integration of knowledge graphs as a contextual grounding layer for generative artificial intelligence and large language models, helping enterprises reduce hallucination risk and improve explainability across applications such as semantic search, fraud detection, and customer intelligence. Enterprise data complexity is a central catalyst for adoption. As organizations increasingly integrate structured, semi-structured, and unstructured data across production systems, cloud platforms, and customer touchpoints, knowledge graphs are being adopted to create relationship-rich, machine-readable representations of data. This enables organizations to model and navigate complex relationships more effectively than traditional relational architectures.
The U.S. Census Bureau's Business Trends and Outlook Survey (BTOS) found that 18% of U.S. firms used AI in at least one business function during the November 2025–January 2026 reference period, rising to 32% on an employment-weighted basis, highlighting the expanding enterprise AI environment that supports demand for contextual data infrastructure. Property graph architectures are also gaining traction in enterprise knowledge graph deployments because of their flexibility, ease of modeling, and efficient traversal of interconnected data at scale.
Key Market Insights
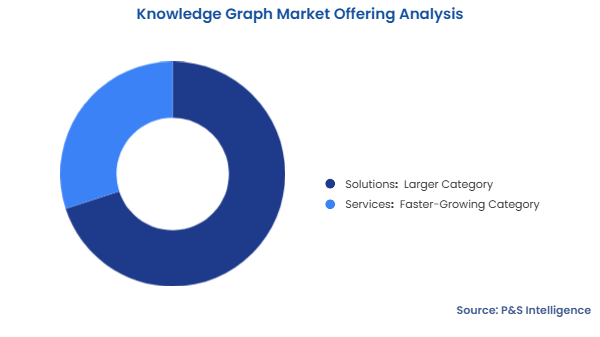
The solutions category holds the larger market share, of 70%, in 2025, driven by growing adoption of platforms and graph engines for managing and analyzing interconnected data.
The RDF / triple store category will have the highest CAGR, of approximately 25.5%, driven by demand for semantic interoperability and standardized data modeling.
The cloud-based category holds the largest market share, of 65%, in 2025, driven by growing demand for scalable and managed graph database services.
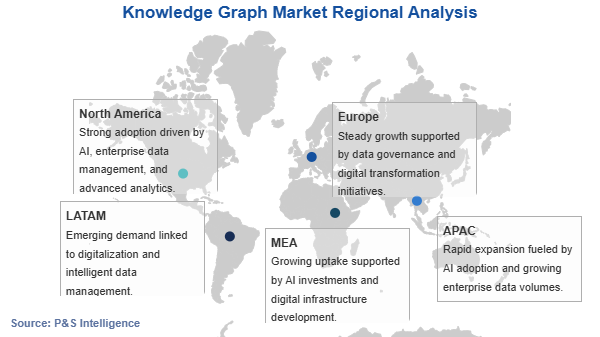
North America holds the largest market share, of 40%, in 2025, driven by major cloud providers, technology companies, and a mature enterprise AI ecosystem.
Asia-Pacific will have the highest CAGR, of approximately 26.0%, driven by rising digital infrastructure investment and rapid cloud and AI adoption.
Knowledge Graph Market Trends and Drivers
Generative AI Grounding and GraphRAG Architectures Are Key Trends
The knowledge graph market is undergoing a structural shift as enterprises increasingly integrate knowledge graphs as embedded semantic layers that ground generative artificial intelligence and large language model outputs in structured, relationship-rich data. Traditional LLM architectures can generate confident but erroneous outputs when reasoning over unstructured information alone. Knowledge graphs can help address this limitation by providing explicit entity relationships and, where implemented, source and provenance context. Graph-based retrieval-augmented generation, or GraphRAG, is gaining traction for multi-hop reasoning tasks that require tracing relationships across disparate enterprise data sources, complementing rather than relying solely on vector-similarity retrieval.
The National Institute of Standards and Technology (NIST) identifies confabulation, defined as the production of confidently stated but erroneous or false content, as one of 12 risks in its Generative Artificial Intelligence Profile, published in July 2024. This trend is expected to strengthen over the forecast period as enterprises increasingly integrate knowledge graphs with AI, data fabric, and semantic-layer architectures. Vendor differentiation is also increasingly expanding beyond standalone graph database capabilities toward integration with existing enterprise data platforms, including zero-copy and virtualized graph approaches that reduce the need to duplicate underlying data.
Regulatory Data-Sharing Mandates and Enterprise Interoperability Requirements Are Biggest Drivers
Regulatory frameworks mandating structured and interoperable data exchange are increasing enterprise requirements for technologies capable of integrating complex data relationships across organizational and system boundaries. As industrial data-sharing and interoperability requirements expand, organizations face growing pressure to establish consistent data structures, vocabularies, metadata, and relationships across previously siloed datasets. These requirements create a favorable environment for graph-based data representation and semantic technologies, which can help organizations integrate interconnected information and improve data traceability across systems and domains.
The European Commission's Data Act became applicable across the European Union from 12 September 2025, establishing requirements related to data access, sharing, and interoperability for connected products, data spaces, and data-processing services. This driver is expected to strengthen over the forecast period as data-interoperability requirements expand across sectors and jurisdictions, supporting enterprise demand for technologies that can provide structured relationship mapping, semantic integration, and auditable data traceability.
Organizational Data Silos and Governance Complexity Are Key Restraints
Persistent organizational silos and fragmented data governance structures continue to constrain the pace of enterprise-wide knowledge graph deployment. Constructing an effective knowledge graph requires integrating data from numerous internal systems, often governed by different teams and standards, creating substantial entity-resolution, schema-mapping, and data-cleansing requirements before organizations can realize analytical value. This complexity can limit initial deployments to targeted use cases rather than enterprise-wide implementations, extending time-to-value and requiring strong governance, cross-functional coordination, and sustained organizational support to overcome barriers to cross-departmental data sharing.
The Organisation for Economic Co-operation and Development identifies organizational silos as one of the most persistent barriers to interoperability and data sharing, noting that dismantling these barriers requires solid governance and coordination arrangements. This restraint is expected to persist in the near term, although advances in entity-resolution automation, ontology alignment, and pre-built industry ontologies have the potential to reduce the integration burden associated with new enterprise deployments.
Healthcare Data Fragmentation Is Biggest Opportunity
Persistent gaps in healthcare data interoperability are creating new opportunities for knowledge graph deployment, as clinical and administrative data continue to span electronic health record systems, payer platforms, and research databases despite years of digitization investment. Knowledge graphs can enable healthcare organizations to connect patient records, clinical trial data, and treatment pathways across previously siloed systems, supporting use cases ranging from clinical decision support to population health analytics that can be difficult to model and traverse efficiently using conventional relational approaches.
The Office of the National Coordinator for Health Information Technology (ONC) reports that 76% of U.S. non-federal acute care hospitals engaged in all four measured interoperability domains in 2025, including electronically sending, receiving, finding, and integrating health information. This indicates that nearly one-quarter of hospitals had not yet engaged across all four measured interoperability domains. This opportunity is expected to expand as healthcare systems pursue more advanced interoperability and data-integration capabilities, creating potential opportunities for knowledge graph vendors among providers seeking to unify fragmented clinical data environments beyond basic record exchange.
Knowledge Graph Market Segmentation Analysis
Offering Analysis
The solutions category holds the larger market share, of 70%, in 2025, driven by the growing adoption of software platforms and graph engines that enable enterprises to build, manage, query, and visualize interconnected data. The U.S. Bureau of Economic Analysis (BEA) reports that software represented 24% of value added among detailed digital-economy activities, highlighting the significant economic contribution of software within the broader digital economy.
The services category will have the higher CAGR, of approximately 25.3%, as enterprises increasingly seek external expertise to design ontologies, integrate disparate data sources, resolve entities, and operationalize GraphRAG and other graph-based AI applications. Organizations with limited in-house graph modeling and data-integration expertise may increasingly rely on external providers to accelerate deployment and reduce implementation complexity.
The offerings analyzed in this report are:
Solutions (Larger Category)
Services (Faster-Growing Category)
Model Type Analysis
The labeled property graph category holds the largest market share, of 45%, in 2025, favored for its intuitive property-attribute structure that allows developers to model entities and relationships without the formal ontology overhead required by triple-store approaches. This accessibility has made LPG the default choice for enterprise application developers building customer-facing recommendation, fraud-detection, and search applications where rapid iteration matters more than formal semantic rigor.
The RDF / triple store category will have the highest CAGR, of approximately 25.5%, as regulated industries such as life sciences and financial services increasingly require the formal semantic rigor and interoperability guarantees that standards-based ontology modeling provides, particularly for cross-organizational data federation use cases where LPG's flexibility becomes a liability rather than an asset. This growth is further supported by the need to integrate complex, cross-organizational datasets while maintaining data consistency, traceability, and compliance.
The model types analyzed in this report are:
Labeled Property Graph (LPG) (Largest Category)
RDF / Triple Store (Fastest-Growing Category)
Ontology-Based / OWL
Others
Data Source Analysis
The unstructured category holds the largest market share, of 60%, in 2025, and it will have the highest CAGR, driven by the increasing use of generative AI and advanced entity extraction technologies to convert unstructured enterprise content into structured, queryable knowledge representations. Enterprises increasingly extract entities and relationships from text documents, emails, contracts, clinical notes, and multimedia content that traditional structured data architectures are not designed to represent and traverse as interconnected semantic relationships. Google Cloud estimates that unstructured data accounts for approximately 70%–90% of the information collected by businesses, highlighting the substantial volume of enterprise content that can potentially be transformed into structured and connected knowledge representations. Knowledge graphs are well suited to this opportunity because they enable organizations to connect entities and relationships extracted from unstructured sources, transforming diverse enterprise content into structured, interconnected, and queryable knowledge.
The data sources analyzed in this report are:
Unstructured Data (Largest and Fastest-Growing Category)
Structured Data
Semi-Structured Data
Deployment Model Analysis
The cloud-based category holds the largest market share in 2025, as organizations increasingly favor managed graph database services that reduce the operational burden of provisioning, scaling, and maintaining graph infrastructure in-house. Cloud deployment also enables more seamless integration with hyperscale AI and data platform services that enterprises are increasingly adopting for generative AI workloads. Eurostat data shows that 52.7% of EU enterprises used paid cloud computing services in 2025, up 7.4 percentage points from 2023, with adoption reaching 84.67% among large enterprises, demonstrating the continued expansion of cloud adoption across European businesses.
The on-premises category will have the highest CAGR, of approximately 25.4%, driven by regulated industries and government agencies that require greater control over sensitive interconnected data for compliance, data sovereignty, security, and regulatory requirements. This creates continued demand for on-premises knowledge graph deployments alongside the broader expansion of cloud-based enterprise infrastructure.
The deployment models analyzed in this report are:
Cloud-Based (Largest Category)
On-Premises (Fastest-Growing Category)
Hybrid
Application Analysis
The data governance & master data management category holds the largest market share, of 25%, in 2025, as organizations use graph-based data models to establish relationship-aware views of enterprise data across fragmented systems of record, supporting regulatory reporting, data lineage tracking, and enterprise-wide entity resolution. The European Commission's Data Governance Act became applicable across the EU on 24 September 2023, establishing a harmonized framework to facilitate data sharing and the reuse of certain public-sector data while strengthening trust in data intermediaries and data-sharing mechanisms. This regulatory environment increases the importance of trusted, governed, and interoperable data-sharing practices across organizations.
The virtual assistants & question answering category will have the highest CAGR, as enterprises increasingly embed knowledge graphs within conversational AI systems to ground responses in structured and organization-specific knowledge rather than relying solely on model parameters. Eurostat data indicates that 8.76% of EU enterprises used AI technologies capable of generating written or spoken language or programming code in 2025, indicating growing enterprise adoption of language-generating AI technologies that can support conversational AI and question-answering applications.
The applications analyzed in this report are:
Semantic Search & Information Retrieval
Data Governance & Master Data Management (Largest Category)
The large enterprises category holds the largest market share, of 75%, in 2025, reflecting their greater data complexity across multiple business units, applications, and legacy systems, as well as their greater capacity to invest in specialized expertise for ontology design, data integration, and graph platform implementation. Eurostat's Digital Intensity Index shows that 96% of large EU enterprises reached at least a basic level of digital intensity in 2025, highlighting the high level of digital adoption and technological readiness among large organizations for advanced data-management solutions.
The small & medium enterprises category will have the highest CAGR, driven by the increasing availability of managed and cloud-native graph database offerings that reduce infrastructure requirements, implementation complexity, and upfront technical investment. These developments are making knowledge graph technologies more accessible to organizations with smaller internal data and engineering teams.
The organization sizes analyzed in this report are:
Large Enterprises (Larger Category)
Small & Medium Enterprises (SMEs) (Faster-Growing Category)
End Use Analysis
The BFSI category holds the largest market share in 2025, driven by the sector's established use of graph-based technologies for fraud detection, anti-money-laundering network analysis, customer intelligence, and increasingly, model risk management across interconnected data environments. The Federal Reserve, Office of the Comptroller of the Currency, and Federal Deposit Insurance Corporation issued revised interagency model risk management guidance in April 2026, emphasizing risk-based model governance tailored to the size, complexity, and model-risk profile of banking organizations, including considerations related to model development, validation, monitoring, governance, controls, and third-party models. This emphasis on managing complex and interconnected model environments supports the broader need for technologies capable of mapping relationships across financial data and risk systems.
The healthcare & life sciences category will have the highest CAGR, of approximately 25.8%, as providers and research organizations increasingly adopt knowledge graphs to connect fragmented clinical, administrative, genomic, and research data environments. The National Institutes of Health's 2025–2030 Strategic Plan for Data Science identifies support for a federated biomedical research data infrastructure as one of its five core goals, with the plan emphasizing greater connections across NIH data platforms, interoperability, FAIR metadata, and integration of distributed biomedical data resources. These priorities reflect the sector's growing need for interconnected and interoperable data architectures, creating a favorable environment for knowledge graph deployment.
The end uses analyzed in this report are:
BFSI (Largest Category)
Healthcare & Life Sciences (Fastest-Growing Category)
Retail & E-commerce
Manufacturing & Automotive
IT & Telecommunications
Government & Public Sector
Media & Entertainment
Energy, Utilities & Infrastructure
Travel & Hospitality
Transportation & Logistics
Others
Drive strategic growth with comprehensive market analysis
Knowledge Graph Market Regional Analysis
North America Knowledge Graph Market Size
North America holds the largest market share, of 40%, in 2025, supported by the region's concentration of major cloud providers, technology companies, and knowledge graph vendors, as well as its advanced enterprise AI ecosystem. The U.S. Census Bureau's Business Trends and Outlook Survey found that 37% of U.S. firms with at least 250 employees were using AI in their business operations as of May, 2026, demonstrating the relatively high level of AI adoption among large enterprises that represent an important customer base for enterprise data and knowledge graph technologies.
The voluntary NIST AI Risk Management Framework provides organizations with guidance for managing AI risks and promoting trustworthy and responsible AI development and deployment. Its emphasis on transparency, accountability, explainability, and reliability supports the broader enterprise focus on AI governance and responsible AI deployment, creating a favorable environment for knowledge graph technologies that can provide structured and traceable data relationships for AI and analytics applications.
U.S. Knowledge Graph Market Size
The U.S. represents the leading country market within North America, sustained by continued enterprise migration toward generative AI-grounded data architectures and a mature investment ecosystem supporting AI and graph technology vendors. The strength of the U.S. AI ecosystem is reflected in USD 285.9 billion in private AI investment in 2025, more than 23 times the investment in China, according to Stanford University's 2026 AI Index. The country also recorded 1,953 newly funded AI companies in 2025, highlighting the depth of its AI innovation and investment ecosystem.
The NIST AI Risk Management Framework, introduced in 2023, provides voluntary guidance for organizations to manage AI risks and incorporate trustworthiness considerations into the design, development, use, and evaluation of AI systems. Its focus on trustworthy and responsible AI provides a supportive governance environment for enterprises deploying AI-enabled data architectures, including applications that require structured, connected, and traceable data.
Asia-Pacific Knowledge Graph Market Size
Asia-Pacific will have the highest CAGR, of approximately 26.0%, supported by expanding digital infrastructure investment, national AI strategies, and rapid enterprise cloud and AI adoption across the region's major economies. Government-led AI initiatives in China and expanding public AI investment in India are strengthening the computing, data, and AI infrastructure on which enterprise knowledge graph adoption can build. In India, the IndiaAI Mission has a budget outlay of INR 10,371.92 crore and includes plans for public AI compute infrastructure of more than 10,000 GPUs, alongside initiatives for data quality, indigenous AI models, and AI startups. Japan, South Korea, and Australia are also advancing enterprise AI and data-integration capabilities, creating additional opportunities for knowledge graph deployment across sectors such as manufacturing, financial services, telecommunications, and public-sector applications.
China Knowledge Graph Market Size
China represents the largest country market within Asia Pacific, driven by sustained government investment in AI infrastructure and an expanding domestic ecosystem of data platform and enterprise software providers translating national AI research and development into enterprise-grade data and knowledge-management solutions.
China's State Council issued guidelines for implementing the AI Plus initiative in August 2025, targeting the penetration rate of next-generation intelligent terminals and AI agents to exceed 70% by 2027 and 90% by 2030. The initiative also calls for strengthening AI model capabilities, data supply, intelligent computing capacity, open-source ecosystems, and AI talent, creating a supportive infrastructure environment for enterprise adoption of AI and related knowledge-management technologies.
The regions and countries analyzed in this report are:
North America (Largest Regional Market)
U.S. (Larger and Faster-Growing Country)
Canada
Europe
Germany (Largest Country)
U.K. (Fastest-Growing Country)
France
Italy
Spain
Rest of Europe
Asia-Pacific (Fastest-Growing Regional Market)
China (Largest Country)
India (Fastest-Growing Country)
Japan
South Korea
Australia
Rest of APAC
Latin America
Brazil (Largest Country)
Mexico (Fastest-Growing Country)
Rest of LATAM
Middle East & Africa
Saudi Arabia (Fastest-Growing Country)
South Africa
U.A.E. (Largest Country)
Rest of MEA
Knowledge Graph Market Competitive Landscape
The market is fragmented because it includes a mix of large technology and cloud providers, specialized graph database companies, semantic technology vendors, and emerging AI-focused providers. Companies such as Microsoft, AWS, Google, IBM, Oracle, and Neo4j have strong market positions, but no single company dominates the entire market. At the same time, numerous specialized vendors compete in areas such as graph databases, semantic knowledge management, data integration, GraphRAG, visualization, and industry-specific solutions. The market also remains fragmented because enterprises have different requirements based on data architecture, use cases, industry regulations, and AI strategies. While larger vendors benefit from established customer bases, cloud infrastructure, and broader technology portfolios, specialized providers compete through graph-native capabilities, flexible architectures, and domain expertise. This competitive structure creates a diverse vendor landscape with opportunities for both established and specialized providers.
Leading Companies in the Knowledge Graph Market:
IBM Corporation
Oracle Corporation
Microsoft Corporation
Amazon Web Services, Inc.
Neo4j, Inc.
Progress Software Corporation
TigerGraph, Inc.
Stardog Union, Inc.
Franz Inc.
OpenLink Software, Inc.
SAP SE
Altair Engineering Inc.
Google LLC
Knowledge Graph Market News
In June 2026, Stardog Union Inc. released Stardog 12.1, advancing its semantic AI platform with expanded Voicebox reasoning and planning capabilities, improved GraphRAG document processing for duplicate-entity resolution, and identity-aware security integrations with Okta and Microsoft Entra ID.
In June 2026, Neo4j Inc. agreed to acquire GraphAware, an intelligence analysis software company serving government agencies. The move forms part of a USD 100 million AI investment roadmap and extends Neo4j's graph technology into sovereign, AI-powered intelligence analysis.
In May 2026, SAP SE completed its acquisition of Reltio Inc., a cloud-native master data management provider. The acquisition strengthens SAP Business Data Cloud's ability to unify, cleanse, and harmonize enterprise data across sources for enterprise-wide agentic AI.
In July 2025, TigerGraph Inc. secured a strategic investment from Cuadrilla Capital to advance its enterprise graph database and AI infrastructure platform. The funding targets expanded capabilities in fraud detection, entity resolution, and customer 360 applications. The investment supports TigerGraph's positioning as core infrastructure for connected-data insights across mission-critical enterprise use cases.
In March 2025, Amazon.com Inc. announced the general availability of GraphRAG within Amazon Bedrock Knowledge Bases. The integration combines graph-based retrieval with Amazon Neptune Analytics to improve the accuracy and explainability of generative AI application responses. The launch enables developers to incorporate entity and relationship extraction into retrieval-augmented generation workflows without prior graph modeling expertise.
Frequently Asked Questions About This Report
What is driving the growth of the knowledge graph market?+
The main growth drivers are enterprise AI and GraphRAG adoption, rising data volume and complexity, demand for semantic search and contextual enterprise data, and increasing requirements for explainable, governed, and interoperable AI.
What are the major trends in the knowledge graph market?+
Key trends include GraphRAG integration with generative AI, knowledge graphs becoming a semantic/context layer for enterprise AI, integration with data lakes and warehouses, semantic search, AI assistants, data governance, fraud detection, and customer intelligence.
What are the major challenges or restraints in the knowledge graph market?+
The main challenges are implementation complexity, data integration, entity resolution, ontology and schema design, data-quality and governance issues, legacy-system integration, graph maintenance, and shortages of specialized skills.
How are knowledge graphs used in generative AI and GraphRAG?+
Knowledge graphs provide structured entities and relationships as a contextual layer for generative AI. GraphRAG can use these relationships to retrieve connected information and support multi-hop reasoning, improving context, relevance, and traceability.
Want a report tailored exactly to your business need?
Leading companies across industries trust us to deliver data-driven insights and innovative solutions for their most critical decisions. From data-driven strategies to actionable insights, we empower the decision-makers who shape industries and define the future. From Fortune 500 companies to innovative startups, we are proud to partner with organisations that drive progress in their industries.
Client Testimonials
Working with P&S Intelligence and their team was an absolute pleasure – their awareness of timelines and commitment to value greatly contributed to our project's success. Eagerly anticipating future collaborations.
McKinsey & Company
India
Unmatched Standards
Our insights into the minutest levels of the markets, including the latest trends and competitive landscape, give you all the answers you need to take your business to new heights
Complete Data Security
We take a cautious approach to protecting your personal and confidential information. Trust is the strongest bond that connects us and our clients, and trust we build by complying with all international and domestic data protection and privacy laws