This Report Provides In-Depth Analysis of the Fiber Optic Components Market Report Prepared by P&S Intelligence, Segmented by Component Type (Transceivers, Active Optical Cables (AOCs), Optical Amplifiers, Optical Splitters and Couplers, Optical Connectors and Cable Assemblies, Optical Circulators and Isolators, Wavelength Division Multiplexers (WDM/CWDM/DWDM)), Data Rate (Less than 10 Gbps, 10 Gbps to 40 Gbps, 41 Gbps to 100 Gbps, More than 100 Gbps), Application (Communications (Data Centers, Telecommunications, Enterprise Networks), Distributed Sensing, Analytical and Medical Equipment, Lighting and Industrial Automation), and Geographical Outlook for the Period of 2022 to 2033
Explore the market potential with our data-driven report
Fiber Optic Components Market Outlook
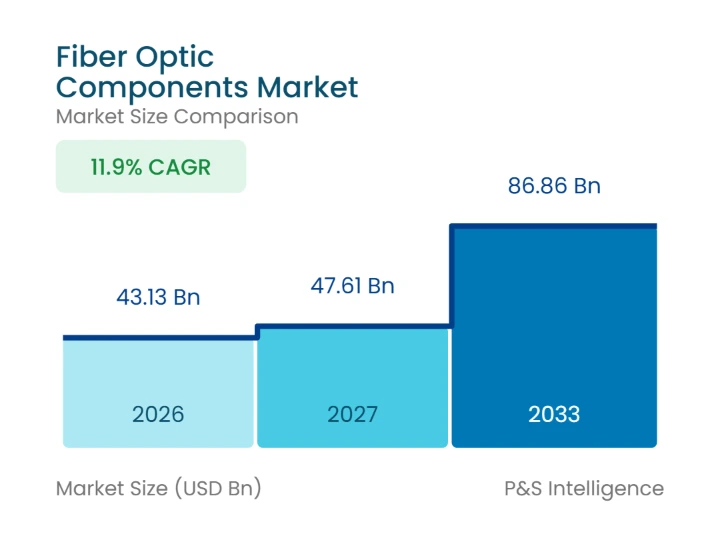
Valued at an estimated USD 43.13 Billion in 2026, the global fiber optic components market is projected to reach USD 47.61 Billion in 2027. Revenue is projected to climb to USD 86.86 Billion by 2033, advancing at a CAGR of 11.9% during 2027-2033 as data center and carrier spending on optics expands. Cloud operators wiring GPU clusters and carriers replacing copper access lines with fiber place most new orders for transceivers, connectors, splitters, and amplifiers. Component makers therefore sell into two purchase cycles, rapid speed upgrades inside data centers and slower, multi-year optical networking builds.
AI training and inference clusters account for much of the new transceiver demand, because every accelerator added to a back-end network needs high-speed optical ports to switches and to neighboring accelerators. According to the International Energy Agency, electricity use by data centers rose 17% in 2025, and AI-focused facilities grew faster still, a sign of how quickly accelerator capacity is being switched on. Power use does not count optical ports directly, but each new cluster carries its own bill of pluggable transceivers, active optical cables, and multi-fiber connectors bought before the first workload runs.
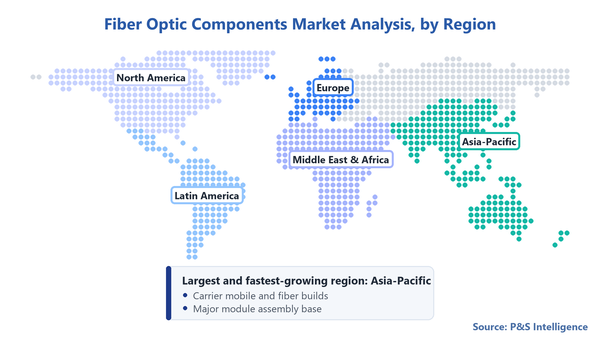
Asia-Pacific held the largest share of the fiber optic components market in 2026 and is also set to post the fastest growth, at an 12.4% CAGR during 2027-2033. China pairs very large mobile and fiber access networks with major module assembly plants, while Japan, Taiwan, and South Korea supply laser chips, substrates, and advanced packaging. North America buys on a different pattern, upgrading existing data center fabrics to faster speeds, so its growth depends more on value per port than on new site volume.
Key market insights
By component type, transceivers held 48.0% of revenue in 2026, while active optical cables (AOCs) are set to expand at a 13.1% CAGR over 2027-2033.
By data rate, the more than 100 Gbps band held 41.5% in 2026, while the 41 Gbps to 100 Gbps band is expected to advance at a 12.8% CAGR during 2027-2033.
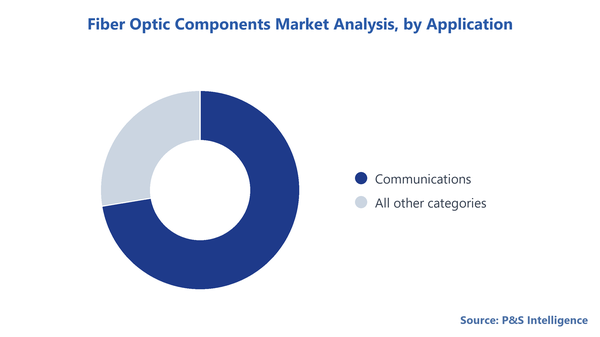
By application, communications (data centers, telecommunications, and enterprise networks) held 72.4% in 2026 and is also expected to grow fastest, at an 11.4% CAGR during 2027-2033.
By geography, Asia-Pacific held 37.9% in 2026 and is also projected to lead growth, with an 12.4% CAGR over 2027-2033.
Fiber Optic Components Market Trends & Drivers
Power limits in AI clusters are redefining how optical links are built
Operators of large AI clusters now treat optical interconnect power as a hard design limit, because every watt drawn by thousands of transceiver ports is a watt unavailable to accelerators inside a fixed rack and facility power envelope. Power budgets are pushing buyers to evaluate linear pluggable optics (LPO), half-retimed modules, and co-packaged optics (CPO) alongside conventional modules built around a full digital signal processor (DSP). Each option changes the purchase. Linear designs remove DSP chips from the module, and co-packaged designs move the optical engine into the switch package, so optics are bought with the switch.
The Optical Internetworking Forum published an implementation agreement in November 2025 for 112 Gb/s retimed transmitter, linear receiver interfaces, which moves receive-side signal processing out of the module and onto the host chip. A published multivendor specification lowers qualification risk for operators that want lower-power modules without tying themselves to one supplier. For module vendors, DSP-light designs could lower selling prices per port while leaving laser and photodetector content intact, so suppliers with in-house laser chips are better positioned to protect margins than assemblers buying chips on the open market.
Accelerator cluster buildouts are propelling volume orders for 800G and 1.6T optics
Hyperscale and AI cloud operators now buy optical modules in quantities set by accelerator counts. A back-end network linking tens of thousands of GPUs typically uses several optical ports per accelerator across server, leaf, and spine layers, so each increase in cluster size multiplies into transceiver, fiber assembly, and connector orders. Every new accelerator generation also pushes operators to the next port speed, from 400G to 800G and then 1.6T, which shortens replacement cycles compared with telecom network optics that stay in service for many years.
Zhongji Innolight's 2025 annual report shows revenue up 60.25% and optical module shipments of 21.09 million units, an increase of 44.6%, with the company linking growth to customers' spending on computing infrastructure. One supplier's results do not size the industry, but they indicate how quickly module capacity is being absorbed by data center buyers. Module makers that clear hyperscale qualification gain long, high-volume production runs that justify new assembly lines, while those outside the approved lists compete for smaller enterprise and telecom orders.
Copper retirement in fixed access networks is opening recurring demand for passive optics
Carriers and regional broadband providers retiring copper and coaxial lines buy a predictable set of optical parts for every fiber-to-the-home (FTTH) build. Each passed street needs planar lightwave circuit (PLC) splitters and connectors, while each activated subscriber adds a pre-terminated drop assembly, an optical subassembly at the customer end, and pluggable optics on the central office line card. Spending therefore continues after construction ends, because operators keep buying optics as take rates rise and new ports are lit.
Figures from the Fiber Broadband Association put U.S. fiber passings at close to 100 million by September 2025, after a record of nearly 12 million homes passed during the preceding year, giving more than 60% of households access to fiber. Homes that are passed but not yet subscribed form a second demand layer, since each activation adds drop, connector, and optical subassembly content regardless of new construction. Suppliers of field-installable connectivity and passive optical network (PON) optics therefore draw revenue from both the build phase and the slower, steadier activation phase.
Indium phosphide supply concentration is constraining laser and photodetector output
High-speed transceivers depend on indium phosphide (InP) lasers and photodetectors, and the supply base for InP wafers and laser chips is narrow. When laser output falls short, module shipments stall regardless of order books, and data center operators face delays in bringing new clusters online. Higher substrate and indium costs also flow into laser prices, and module vendors may not recover all of that increase from large data center buyers. Laser shortages therefore cut into both shipment volume and margin across the transceiver chain.
Per the U.S. Geological Survey, China accounts for 70% of world indium production, and after its February 2025 export restrictions on indium, Chinese exports of unwrought indium fell 72% year over year between September 2024 and September 2025. That concentration exposes laser makers outside China to input shortages and price spikes. Substrate and laser makers in Japan and the U.S. have responded by adding InP capacity, which could strengthen the position of transceiver suppliers that can document non-Chinese material sources during hyperscale qualification.
Segmentation Analysis
Component Type
Transceivers accounted for 48.0% of revenue in 2026, because every pluggable optical link needs a module at each end and each module carries the costliest parts of the link, the lasers, photodetectors, and driver electronics. Data center operators replace transceivers with each switch generation, which earns the category repeat revenue from the same racks. Telecom carriers add coherent pluggables for metro and data center interconnect routes, and these carry higher unit prices than short-reach modules, lifting the category's share of spending further.
Active optical cables (AOCs) are expected to post the quickest growth among component types, at a 13.1% CAGR during 2027-2033. The IEEE P802.3dj task force's adopted objectives specify copper twin-axial links of at least 1.0 meter at 200 Gb/s per lane, against at least 500 meters for single-mode fiber, so connections between neighboring racks in AI clusters shift from passive copper to optics as lane speeds rise. AOCs suit these short runs because the optics are sealed into the cable, which removes connector cleaning. AOC makers with volume access to optical engines are better positioned as cluster sizes grow.
Data Rate
The more than 100 Gbps band held 41.5% of revenue in 2026. It covers the 400G, 800G, and 1.6T modules that hyperscale operators buy for AI back-end and cloud spine networks, plus coherent modules for long-haul and data center interconnect routes. Unit prices in this band are the highest in the market, and each new speed generation tends to command premium pricing during the first years of its ramp, so revenue concentrates here even though slower modules likely still ship in larger numbers across enterprise and access networks.
The 41 Gbps to 100 Gbps band is set to grow fastest, at a 12.8% CAGR during 2027-2033, as 100G becomes the standard speed outside hyperscale fabrics. Enterprise campus uplinks, mobile fronthaul and midhaul aggregation, and metro access rings are moving from 10G and 25G links toward 100G as prices for these modules decline. Fixed access adds a second demand source, since ITU-T Recommendation G.9804.3, last amended in February 2026, defines the physical layer for 50-gigabit passive optical networks. Suppliers with low-cost 50G and 100G designs can sell to a far wider customer base than the hyperscale tier.
Application
Communications, which spans data centers, telecommunications, and enterprise networks, accounted for 72.4% of revenue in 2026. Cloud and colocation operators, telecom carriers, and enterprise IT departments all buy here, across the range from transceivers to splitters and amplifiers. The U.S. Census Bureau estimates private data center construction at a seasonally adjusted annual rate of USD 84.95 Billion in August 2026, up from USD 49.05 Billion a year earlier, building work that precedes the optics fitted inside. Because the category draws on several budgets at once, it is less exposed to a pause in any single one.
The same category is projected to grow fastest, at an 11.4% CAGR during 2027-2033, as AI clusters raise optical port counts per data center hall and carriers keep extending fiber access. Makers of distributed sensing systems for pipelines, power cables, and rail lines, along with producers of analytical and medical equipment and of lighting and industrial automation gear, buy specialized lasers, couplers, and connectors in smaller volumes with longer qualification periods. Communications volumes fill the fabs and assembly lines, while the specialty applications can offer steadier pricing because fewer suppliers compete for each design win.
The following segments are analysed in this report.
Copyright P&S Intelligence. Reuse requires attribution under CC BY 4.0.
Geographical Outlook
Asia-Pacific fiber optic components market outlook
Asia-Pacific held 37.9% of global revenue in 2026 and is projected to post the fastest growth, at an 12.4% CAGR during 2027-2033. The region is both a major assembly base for optical modules and a large end market, because Chinese carriers buy at national scale for mobile and fiber access networks while regional module plants serve overseas cloud operators. China is the region's largest market. Its Ministry of Industry and Information Technology recorded 5.195 million 5G base stations at the end of August 2026, a base that generates orders for fronthaul and backhaul optics as sites are added and upgraded.
Japan adds supply depth. Sumitomo Electric's president's message commits the company to strengthening production capacity for optical connectors, optical devices, and InP substrates to meet data center demand driven by generative AI, which means part of the region's growth comes from materials and chips as well as finished modules. Taiwan's foundries are developing packaging for silicon photonics and co-packaged optics. The Asia-Pacific fiber optic components market looks set to strengthen its position through 2033, although domestic-assembly rules in some government-funded networks abroad could redirect part of the region's export volume.
Copyright P&S Intelligence. Reuse requires attribution under CC BY 4.0.
North America market analysis
North America's demand is concentrated in a small group of U.S. hyperscale and AI cloud operators that buy 800G and 1.6T optics in large, qualification-heavy batches tied to each new switch and accelerator generation. Growth here comes mainly from upgrades inside existing campuses and from new data center halls, with value per port rising at each speed step. Canada adds carrier and rural broadband spending, and U.S. fiber-optic cable builds create matching demand for connectors, splitters, and pre-terminated assemblies in access networks.
A second channel comes from subsidized rural broadband. Under the National Telecommunications and Information Administration's February 2024 Buy America waiver for the Broadband Equity, Access, and Deployment (BEAD) program, optical pluggables remain one of four electronics categories that must still undergo named manufacturing steps, such as assembly, testing, and packaging, in the U.S. for five years from February 22, 2024. The rule favors transceiver makers with U.S. assembly and test lines when BEAD-funded projects buy optics, and narrows that funding stream for imported modules. North America's position looks stable, anchored by hyperscale refresh spending.
Europe market analysis
Europe accounts for a mid-sized portion of global demand, most of it from carriers completing fiber-to-the-premises networks and retiring copper, so passive components, PON optics, and connectivity likely make up a larger part of regional spending than in North America. Data center demand is concentrated around Frankfurt, London, Amsterdam, Paris, and Dublin, where cloud operators expand capacity under tight power and land limits. Buyers in the region tend to favor suppliers with local stock and EU-based support, because carrier tenders often weigh delivery time and service alongside price.
The European Commission's Digital Decade 2026 report finds that fiber-to-the-premises coverage across the EU reached 74.1% as of mid-2025, against a 2030 goal of gigabit coverage for every household. The premises still to be reached tend to cost more per connection, which shifts spending toward hardened connectors and pre-terminated assemblies that reduce field labor, and toward PON optics as operators upgrade networks built in earlier phases. For suppliers, Europe offers a steady, tender-driven order book with smaller swings than data center demand.
Latin America market analysis
Latin America contributes a smaller share of global revenue, and its demand comes more from fiber access than from data center optics. Brazil stands out because many regional internet providers, alongside national carriers, have built much of its fiber footprint, and these smaller operators buy through distributors on tight budgets. Mexico, Chile, and Colombia add carrier fiber programs and a growing number of colocation and cloud data center projects, particularly around Querétaro and Santiago.
Anatel data show 55.4 million fixed broadband accesses in Brazil in the second quarter of 2026, with fiber accounting for more than 80% of them, or 44.7 million lines. A fiber base of that size generates upgrade and replacement demand for customer-end optical subassemblies, splitters, and connectors as the network matures. Price-sensitive regional operators tend to favor lower-cost PLC splitters and PON optics, which suits suppliers with low-cost manufacturing and local distribution, while carriers moving to 10G PON open room for higher-specification modules.
Middle East & Africa market analysis
The Middle East & Africa holds a smaller share of global demand, and state-backed programs drive much of its spending. In Saudi Arabia, the U.A.E., and Qatar, national fiber networks and data center campuses tied to diversification plans generate many component orders, often through turnkey contracts in which systems integrators select the optics. The U.A.E.'s Telecommunications and Digital Government Regulatory Authority (TDRA) confirmed in March 2026 that the country ranked first worldwide in fiber-to-the-home coverage for a tenth consecutive year. Gulf orders therefore lean toward network upgrades and data center optics, which favors suppliers already qualified with the main integrators.
Across Africa, new submarine cable landings and the inland backbones that distribute their capacity generate orders for dense wavelength division multiplexing (DWDM) filters, optical amplifiers, and long-reach transceivers, with South Africa, Nigeria, Egypt, and Morocco serving as the main hubs. Mobile operators extending fiber to cell sites add a second, more fragmented stream of orders for connectors and short-reach optics. Because integrators and operators in many African markets buy in smaller lots, distributors with regional stock carry much of the volume, and component makers reach these buyers mostly through channel partners.
The following geographies are analysed in this report.
The fiber optic components market is moderately fragmented, because it spans product layers with different economics. High-speed transceivers and laser chips require InP or silicon photonics fabs, lengthy hyperscale qualification, and large assembly capacity, which concentrates that layer among a smaller group of vertically integrated suppliers. Passive parts such as splitters, connectors, and WDM filters need less capital and sell through distributors and carrier tenders, so many regional manufacturers compete there on price and delivery. The structure is evolving, as each AI-driven speed step raises fab and qualification requirements in the active layer while the passive layer stays open.
Competition sorts into three clusters. Zhongji Innolight, Coherent, Lumentum, Accelink, and Cisco compete in high-speed datacom and coherent telecom transceivers, with several of them making their own lasers or optical engines. Sumitomo Electric and Furukawa Electric combine optical devices and amplifier components with fiber and connector production, serving carriers that prefer broad portfolios. Corning, Amphenol, and TE Connectivity compete in high-density connectors, cable assemblies, and transceiver cage hardware, where port density and installation speed weigh heavily in hyperscale design wins.
For data center buyers, qualification is one of the main switching costs. Hyperscale operators test each module type for interoperability, reliability, and thermal behavior before adding a vendor, so approved supplier lists change slowly and new entrants usually gain ground one product generation at a time. Access to laser chips is a second barrier, since module makers without in-house InP capacity compete for the same constrained merchant supply. In carrier and publicly funded networks, domestic-assembly rules and tender qualification increasingly determine which suppliers can bid at all.
Major Companies in Fiber Optic Components Market:
Coherent Corp.
Lumentum Holdings Inc.
Broadcom Inc.
Sumitomo Electric Industries Ltd.
Accelink Technologies Co. Ltd.
Zhongji Innolight Co. Ltd.
Furukawa Electric Co. Ltd.
Cisco Systems Inc.
Corning Incorporated
Amphenol Corporation
TE Connectivity plc
Recent Developments in the Market
In March 2026, Lumentum Holdings Inc. announced a 240,000-square-foot manufacturing site in Greensboro, North Carolina, acquired from Qorvo, Inc., to produce InP continuous wave and ultra-high-power lasers, with production expected to ramp in mid-2028. The site adds U.S. capacity for the laser chips that currently cap high-speed transceiver output.
In March 2026, Coherent Corp. demonstrated 1.6T transceivers built on four optical technologies, among them silicon photonics, 200G InP EMLs, and 200G GaAs VCSELs, plus 400G-per-lane links for future 3.2T modules, at OFC 2026. Several laser options at one speed let hyperscale buyers qualify alternatives when one chip type runs short.
In March 2026, Broadcom Inc. began sampling the Taurus BCM83640, a 3nm 1.6T PAM-4 optical DSP with 400G-per-lane optical interfaces and an integrated laser driver, to early access customers and partners. Four 400G optical lanes in place of eight 200G lanes reduce the lasers and photodetectors each 1.6T module needs while InP laser supply stays tight.
In January 2026, Corning Incorporated signed a multiyear agreement worth up to USD 6 Billion to supply Meta Platforms, Inc. with optical fiber, cable, and connectivity products, with Meta as anchor customer for a capacity expansion at Corning's optical cable plant in Hickory, North Carolina. The agreement ties a share of Corning's U.S. connectivity output to one hyperscale buyer's AI data center buildout.
In January 2026, Amphenol Corporation completed its USD 10.5 Billion acquisition of CommScope's Connectivity and Cable Solutions business, adding fiber-optic interconnect lines for IT datacom and communications networks. The deal brings hyperscale connectivity and carrier fiber products under one supplier, widening the range of components Amphenol can bundle into a single order.
Last Updated: October 2026
Frequently Asked Questions About This Report
How big is the fiber optic components market?+
Valued at an estimated USD 43.13 Billion in 2026, the global fiber optic components market is projected to reach USD 47.61 Billion in 2027.
What is the growth rate of the fiber optic components market?+
Revenue is projected to climb to USD 86.86 Billion by 2033, advancing at a CAGR of 11.9% during 2027-2033 as data center and carrier spending on optics expands.
What is driving demand for fiber optic components?+
AI training and inference clusters account for much of the new transceiver demand, because every accelerator added to a back-end network needs high-speed optical ports to switches and to neighboring accelerators.
Which region dominates the fiber optic components market?+
Asia-Pacific held the largest share of the fiber optic components market in 2026 and is also set to post the fastest growth, at an 12.4% CAGR during 2027-2033.
Which component holds the largest share of the fiber optic components market?+
By component type, transceivers held 48.0% of revenue in 2026, while active optical cables (AOCs) are set to expand at a 13.1% CAGR over 2027-2033.
Who are the key players in the fiber optic components market?+
Zhongji Innolight, Coherent, Lumentum, Accelink, and Cisco compete in high-speed datacom and coherent telecom transceivers, with several of them making their own lasers or optical engines.
Want a report tailored exactly to your business need?
Leading companies across industries trust us to deliver data-driven insights and innovative solutions for their most critical decisions. From data-driven strategies to actionable insights, we empower the decision-makers who shape industries and define the future. From Fortune 500 companies to innovative startups, we are proud to partner with organisations that drive progress in their industries.
Client Testimonials
Working with P&S Intelligence and their team was an absolute pleasure – their awareness of timelines and commitment to value greatly contributed to our project's success. Eagerly anticipating future collaborations.
McKinsey & Company
India
Unmatched Standards
Our insights into the minutest levels of the markets, including the latest trends and competitive landscape, give you all the answers you need to take your business to new heights
Complete Data Security
We take a cautious approach to protecting your personal and confidential information. Trust is the strongest bond that connects us and our clients, and trust we build by complying with all international and domestic data protection and privacy laws